Products
Skills, prompt kits and templates for working with AI.
Product list
- SkillNew
Create SVG charts with AI
Choose a chart around the finding, record its data once and generate an inline SVG. An optional route turns that same specification into editable PowerPoint shapes.
Free - SkillNew
Technical SVG diagrams with AI
Organise nodes, connections and legends in a self-contained technical diagram
Free - SkillNew
Create draw.io diagrams with AI
Create editable process and relationship diagrams, validate their XML and optionally convert Mermaid into documentation images that retain an editable source.
Free - SkillNew
Build interactive data stories with AI
Develop a sourced visual argument through a brief, storyboard and interactive implementation, with staged review of evidence, mobile behaviour and the final result.
Free - SkillNew
Plot scientific data with AI
Generate a reproducible plotting script and figure in a consistent scienceplots lab style.
Free - SkillNew
Write a dashboard brief with AI
Agree what a dashboard should answer, how each metric is calculated and who needs to see it before your data team begins the build.
Free - SkillNew
Make a chart with AI
Turn a labelled dataset into a branded chart or diagram. Check units, axis baselines and relationships before exporting a PNG or SVG for your report.
Free - SkillNew
Draw a neural network diagram with AI
Turn a PyTorch model definition into an editable Excalidraw scene, with a block overview or a closer view of individual operations.
Free - SkillNew
Explain data findings with AI
Find the point a reader needs from a finished analysis. Pick evidence for each claim and connect the recommendation to what the figures actually show.
Free - SkillNew
Build an interactive map with AI
Combine locations and public layers in GISMap Online, check the view against your question and decide how the finished map should be shared.
Free - SkillNew
Build an interactive web map with AI
Start with one verified location or boundary, choose the opening view and keep the map files editable in your own project.
Free - SkillNew
Georeference a scanned map in QGIS with AI
Match recognisable points on a scan to map coordinates, inspect the residuals and decide whether the output needs a world file or a warped raster.
Free - SkillNew
Choose the right chart with AI
Start from the comparison your reader needs to make, then choose the chart form, scale and labels that make that comparison possible.
Free - SkillNew
Build a weather map with AI
Compose an Xweather raster map or tile template, arrange its layers and estimate the map units before requesting a live image.
Free - SkillNew
Check journal figures with AI
Find print-size readability issues and trace some of them to the plotting code. Keep publisher requirements separate from visual suggestions.
Free - SkillNew
Design maths paper figures with AI
Turn one step of a proof into an editable figure, then check the labels against the manuscript at its actual print width.
Free - SkillNew
Make a diagram readable with AI
Fit an auto-generated graph to the space where it will actually appear, then check that its labels and connections still tell the same story.
Free - SkillNew
Draw a workflow diagram with AI
Turn annotated project steps into editable Mermaid source so a reader can follow how inputs, scripts and outputs fit together.
Free - SkillNew
Draw D2 diagrams with AI
Describe a process or system as editable text, try alternative layouts and inspect the result at the size your audience will see.
Free - SkillNew
Create Mermaid diagrams with AI
Turn a written process or comparison into editable Mermaid code, with labelled decisions and a layout suited to its readers.
Free - SkillNew
Write a dashboard specification with AI
Define who needs the dashboard, which decision it serves and what its metrics, filters and acceptance checks must mean in practice.
Free - SkillNew
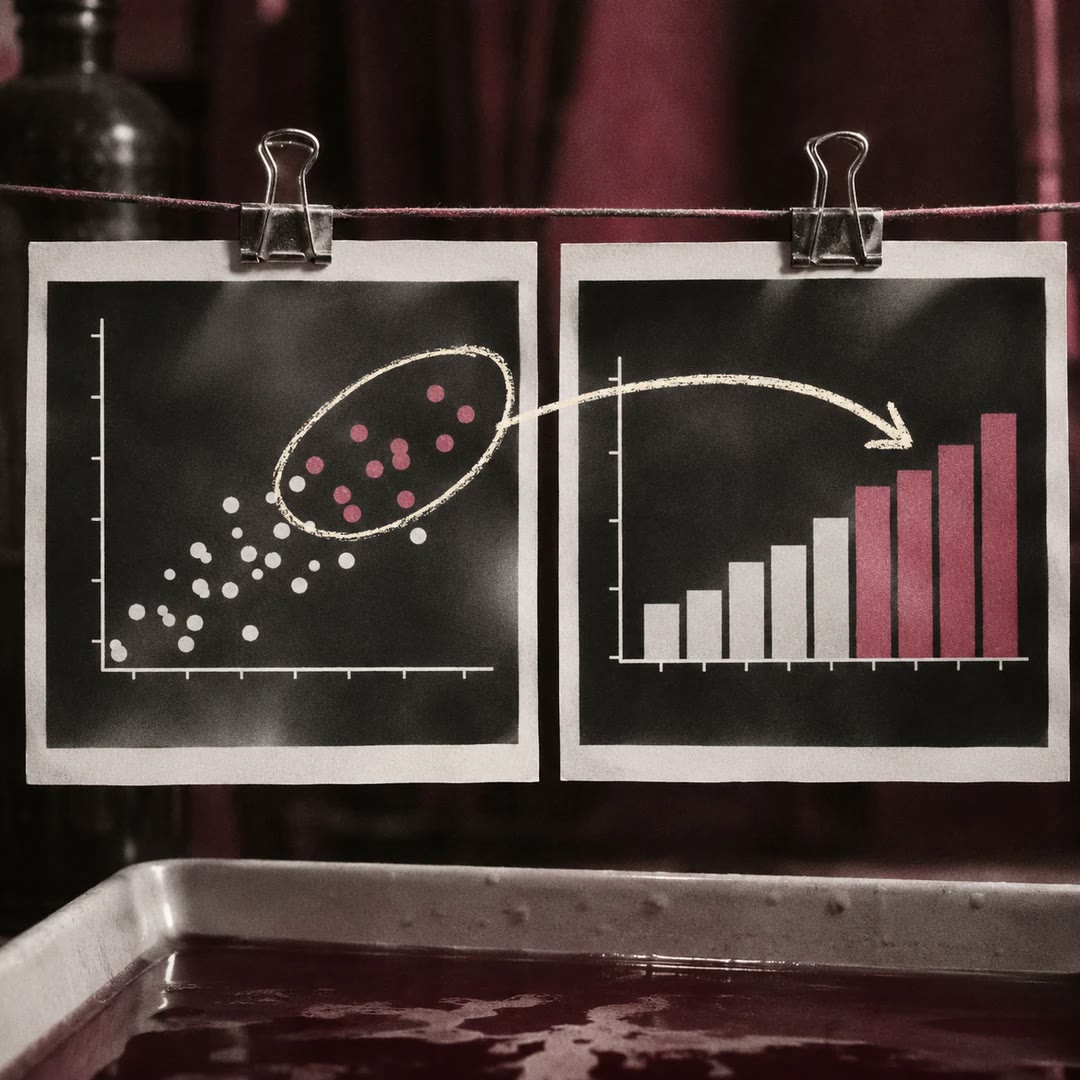
Build linked charts with AI
Let readers select a group of points in one view and see which records survive in the others.
Free - SkillNew
Build an interactive GeoLibre map with AI
Create a map project with styled layers and a matching legend, then check which data travels with the file and which sources the viewer still needs.
Free - SkillNew
Choose a chart with AI
Turn an analytical question and a set of columns into a chart specification with a reason for each visual choice.
Free - SkillNew
Build a Kibana dashboard with AI
Create a reviewable dashboard definition with Lens panels, filters and controls. Match chart layers to the dataset, then check the saved view in its target space.
Free - SkillNew
Manage Mixpanel boards with AI
Inventory dashboards, duplicate an existing board or rebuild a template in another project. Review destructive edits and read the saved layout back after changes.
Free - SkillNew
Build a Mixpanel dashboard with AI
Give a product team a live board that answers a specific question. Check events and chart results first, then group the measures and add context where it matters.
Free - SkillNew
Create research diagrams with AI
Turn a research workflow or argument into editable Mermaid source, keeping the figure’s question, evidence and relationship labels visible to reviewers.
Free - SkillNew
Build an editable business chart with AI
Turn a prepared table into an editable VisActor chart configuration. Add a meaningful annotation, produce an image or deliver a supported chart to an authorised document.
Free - SkillNew
Make an interactive data report with AI
Shape a set of findings into a browser report or web presentation. Connect each claim to its chart, source and time period, then inspect the reading experience.
Free - SkillNew
Build Omni dashboards with AI
Turn a specific reporting need into dashboard tiles, filters and readable charts in an Omni document that the intended audience can actually use.
Free - SkillNew
Build Directus dashboards with AI
Put counts, time series and filtered lists together in Insights. The dashboard uses each viewer’s own access to the underlying collections.
Free - SkillNew
Choose a chart for data with AI
Select a chart around a reader’s question, then prepare a specification or configuration for the tool that will draw it. Test it with representative values.
Free - SkillNew
Review chart accessibility with AI
Check how a chart communicates without colour or a mouse. Inspect text alternatives, keyboard behaviour and access to values, then test the findings on the page.
Free - SkillNew
Make an inline CARTO map with AI
Explore a spatial question in a supported chat. Choose what a symbol or colour means and keep a legend beside the temporary map.
Free - SkillNew
Preview a saved CARTO map with AI
Open the existing Builder map inside a supported chat. Preserve its layers, popups and initial view while checking that the right saved version is on screen.
Free - SkillNew
Build a CARTO map with AI
Create a saved Builder map from authorised warehouse data. Choose layers, styling, popups and sharing settings, then check what viewers can actually see.
Free - SkillNew
Make an ECMWF weather map with AI
Choose a weather layer, area and valid time. Get an ECMWF chart image or a small interactive web map backed by the service’s own map tiles.
Free - SkillNew
Build a MotherDuck dashboard with AI
Plan a dashboard around its audience and decisions, check the metrics against the underlying data and choose a delivery format with suitable access.
Free - SkillNew
Design a MotherDuck Dive with AI
Create or update an interactive report with read-only data queries, clear loading and empty states, and an explicit choice about sharing or embedding.
Free - SkillNew
Convert a Streamlit app to marimo with AI
Move widgets, layout and calculations into a reactive Python notebook. Review how state, caching and custom controls behave after the conversion.
Free - SkillNew
Build a Shiny dashboard with AI
Arrange filters, headline figures and charts around the reader’s first question. Preview the layout with a small dataset before connecting the full report.
Free - SkillNew
Create charts from SQL data with AI
Express a visualisation alongside the data query using ggsql. Choose layers, scales, facets and labels that fit the underlying data and the comparison you need.
Free - SkillNew
Build amCharts charts with AI
Choose a chart that fits the question and integrate it into a web project. Configure axes, legends and interactions using the relevant amCharts 5 examples.
Free - SkillNew
Choose a MapLibre data source with AI
Compare a GeoJSON file, vector tiles and raster tiles against a real map. Consider shape complexity, update frequency and how the first view performs on a phone.
Free - SkillNew
Draw a flowchart with AI and D2
Describe a process and get a text-based diagram you can edit, plus a rendered file for readers. Change a label or route without rebuilding the drawing by hand.
Free - SkillNew
Make a chart from Excel with AI
Choose a chart for your question, generate it in Python and keep the figure and plotting code for the next reporting cycle.
Free - SkillNew
Build Plotly charts with AI
Give your agent a table and the question behind it. Get a Plotly figure with labelled axes, details on hover and an export suited to its readers.
Free