Find World Bank data with AI
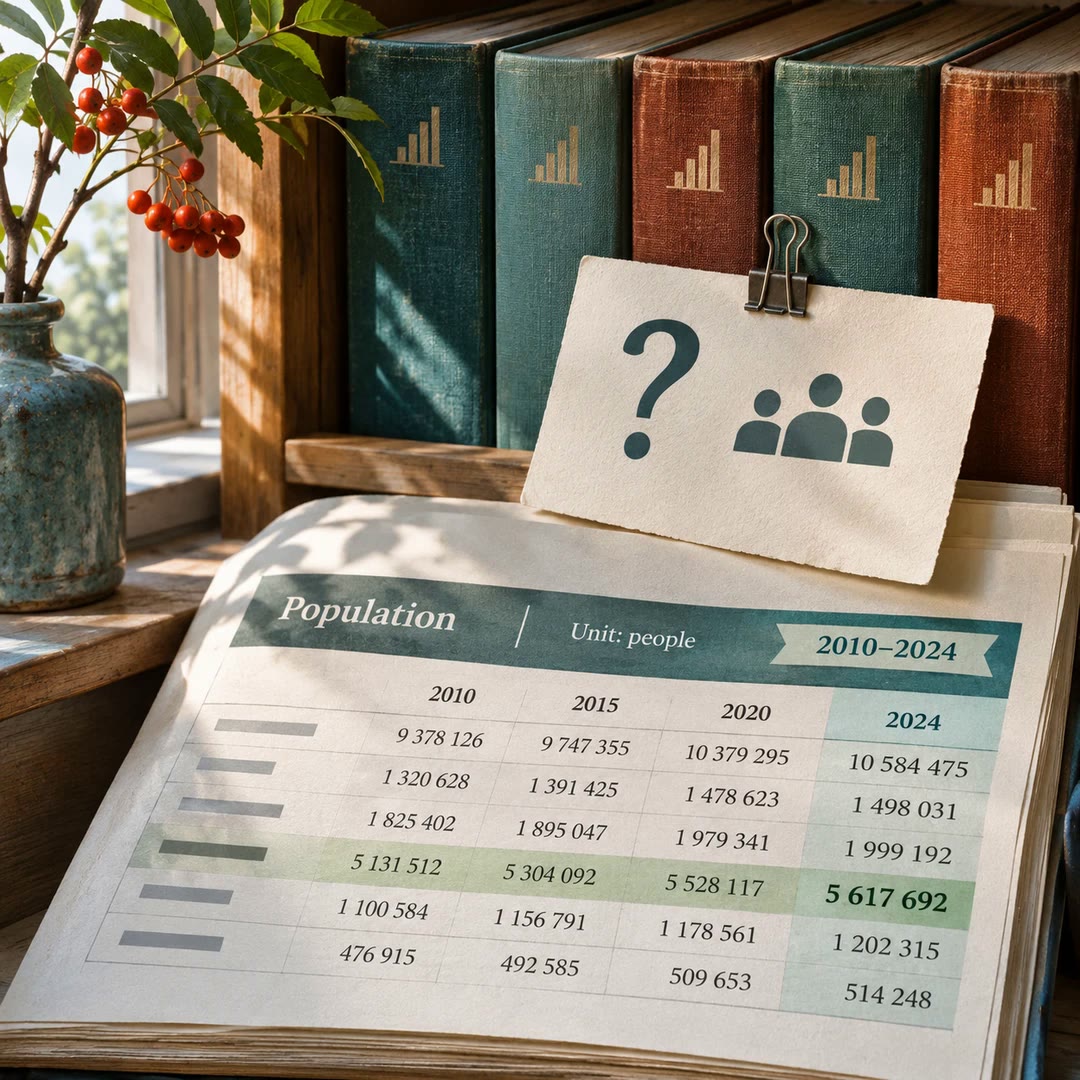
Look up an indicator, its unit and its observation year. Compare like periods and keep missing values visible when preparing a table for a report.
Find World Bank data with AI by deciding which figure would answer your question. An urban population total and an urban share describe the same topic in different units. A useful first result gives the indicator name and definition before presenting a column of plausible numbers.
The worldbank-api guide helps an agent query the public Indicators API and interpret the response. Asking for the latest observation can return different years across economies. A table intended for a year-by-year comparison should expose that difference or use a shared period with explicit gaps.
What it does
- Find an indicator code from a relevant search term
- Read the measurement unit alongside each series
- Compare observations for a specified range of years
- Distinguish regional totals from their constituent economies
- Return a concise table or machine-readable records
Install and use
- Use an internet-connected agent. The bundled helper needs Python, and the public API requires no registration or key. Supply the subject, geography and period.
- Ask, “Compare the urban population share for these regions in one common year. Show each series identifier and flag any region missing that observation.”
- Inspect the returned dates and units. For a large request, check pagination or split the selection so the final table covers all intended rows.
FAQ
Source
Made by NanookAI. Original skill: worldbank-api, published on GitHub under the MIT licence.
View on GitHubRelated products
- SkillNew
Estimate your carbon footprint with AI
Use your own bills and receipts to build an emissions range, retain the source behind each figure and compare changes without hiding uncertainty.
Free - SkillNew
Find official statistics with AI
Ask a specific question of a PxWebApi v2 statistics service. Get the figures with the table, units and time period needed to quote them accurately.
Free - SkillNew
Review astrophotography data with AI
Work out which stage to revisit when a stack has dust shadows, uneven colour or stars that look different across the frame.
Free