Analyse statistics with AI
Choose a summary that suits your data, investigate unusual observations and judge whether a measured difference matters in practice.
To analyse statistics with AI, begin with the decision the figures are meant to support. A rise in average dispatch time might affect nearly every order, or a handful of exceptionally late parcels might account for most of it. The statistical-analysis guide covers summaries, variation, trends and tests that help distinguish those possibilities.
Keep the comparison periods and units visible. A week with a public holiday can contain a different mix of orders from a normal week. A difference may also be measurable yet too small to justify changing a shift. The size of the effect belongs beside the uncertainty around it.
What it does
- Compare the mean and median of a skewed measure
- Describe variation with percentiles or spread
- Investigate the influence of unusual observations
- Check weekly patterns before interpreting a trend
- Discuss the practical importance of a test result
Install and use
- Install the Data plugin in a compatible agent. The background guide applies to relevant requests. Supply an authorised dataset and a suitable Python environment for calculations.
- Ask “Compare dispatch times across these two periods. Show the median and spread, then explain how the longest delays affect the mean.”
- Check each group’s sample size and express the effect in the original unit before deciding what to change.
FAQ
Source
Made by Anthropic. Original skill: statistical-analysis, published on GitHub under the Apache-2.0 licence.
View on GitHubRelated products
- SkillNew
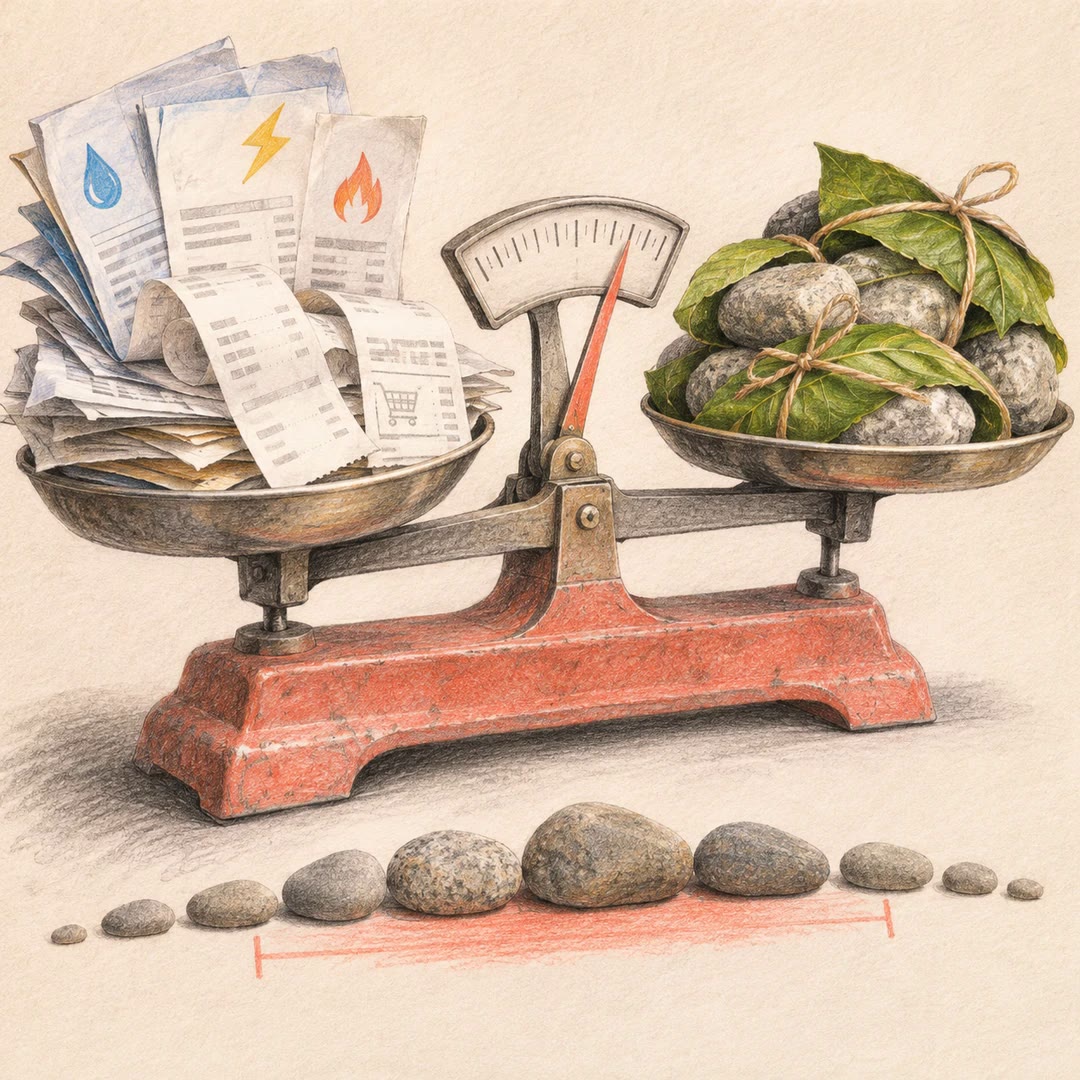
Estimate your carbon footprint with AI
Use your own bills and receipts to build an emissions range, retain the source behind each figure and compare changes without hiding uncertainty.
Free - SkillNew
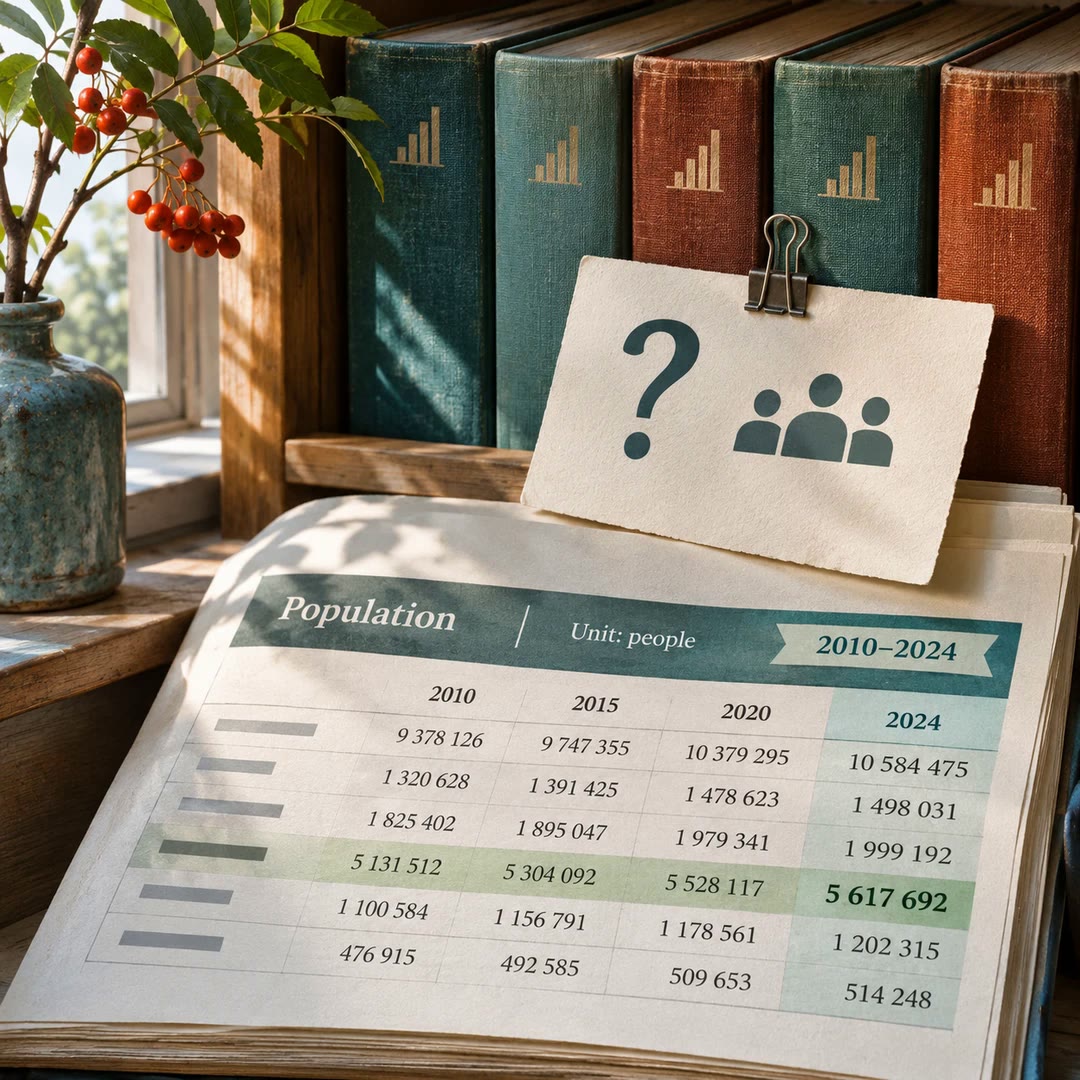
Find official statistics with AI
Ask a specific question of a PxWebApi v2 statistics service. Get the figures with the table, units and time period needed to quote them accurately.
Free - SkillNew
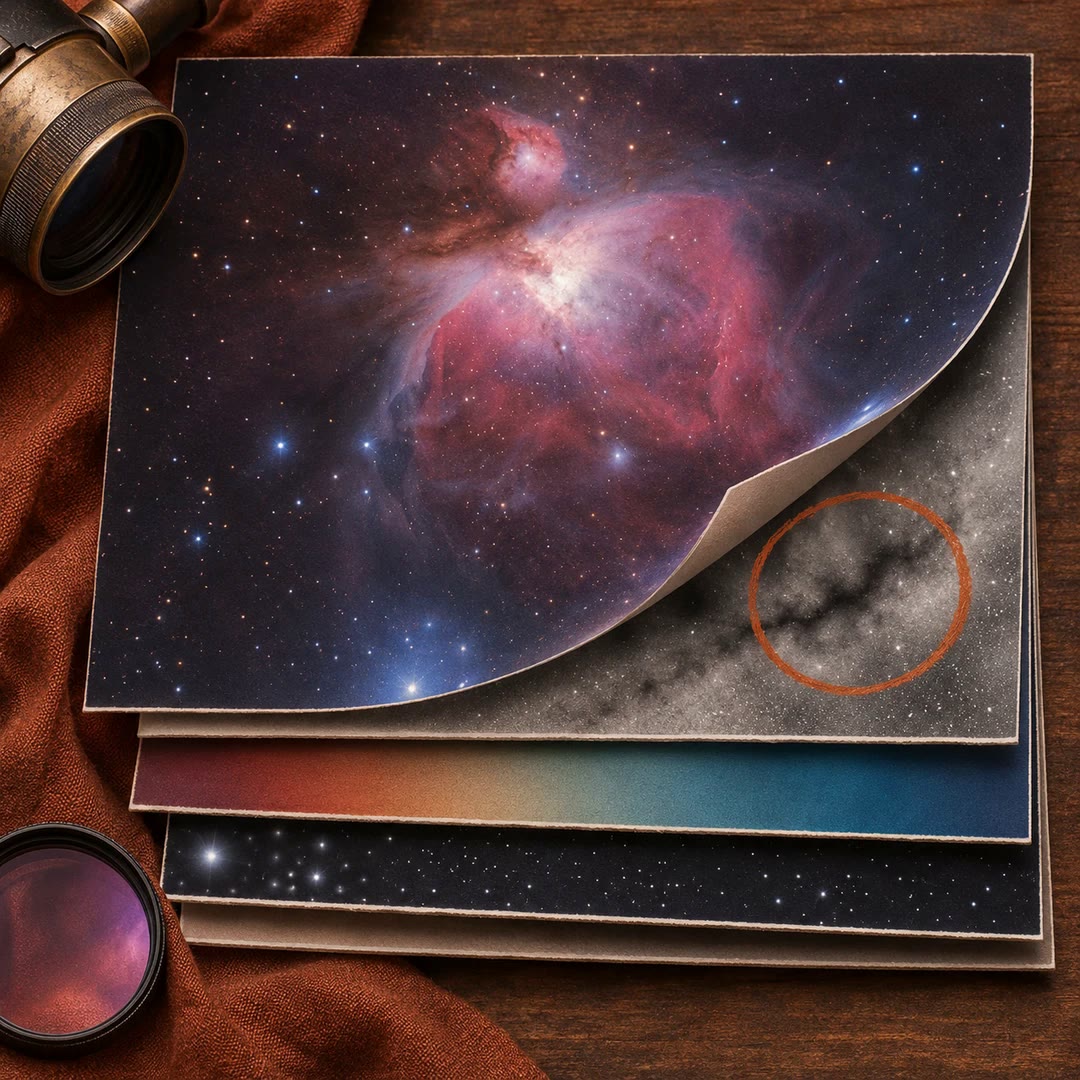
Review astrophotography data with AI
Work out which stage to revisit when a stack has dust shadows, uneven colour or stars that look different across the frame.
Free