Analyse RevenueCat subscription charts with AI
Compare revenue, acquisition, conversion or retention using the same metric and cohort window. Keep the date range, filters and denominator attached to each result.
Analyse RevenueCat subscription charts with AI when a movement in the headline numbers needs a closer look. The revenuecat-charts skill checks which options a chart supports, requests current data and interprets the response in context. It can compare stores or product groups while retaining an overall baseline.
A trial conversion rate depends on who entered the trial and how long they had to convert. An incomplete recent cohort cannot be interpreted like an older one with a full observation window. The workflow makes that distinction explicit and checks project annotations before suggesting an explanation for a shift.
What it does
- Compare two periods on the same chart definition.
- Break a supported metric down by store or subscription duration.
- Identify a segment dominating a blended rate.
- Check a cohort’s observation window before discussing retention.
- Prepare a dashboard link with the relevant date range and filters.
Install and use
- Install the official RevenueCat toolkit with the skill. Connect the authorised MCP server and an account with access to the project’s charts. The official CLI also supports a subset of chart operations.
- Ask, “Compare monthly-plan trial conversion with last month. Show the cohort window, dates and denominator beside the result.”
- Check the filter settings, coverage and partial periods before quoting the numbers in a review.
FAQ
Source
Made by RevenueCat. Original skill: revenuecat-charts, published on GitHub under the MIT licence.
View on GitHubRelated products
- SkillNew
Estimate your carbon footprint with AI
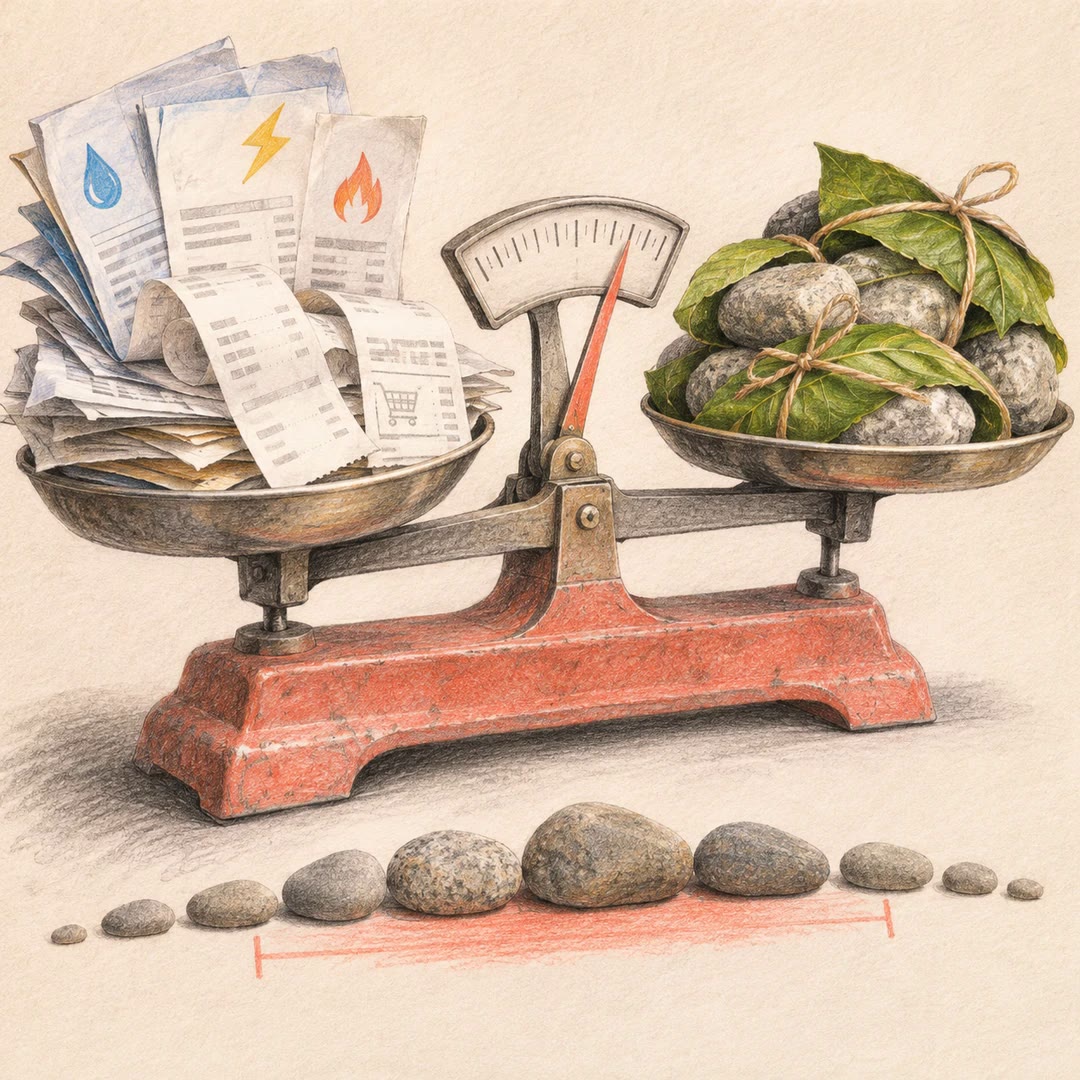
Use your own bills and receipts to build an emissions range, retain the source behind each figure and compare changes without hiding uncertainty.
Free - SkillNew
Find official statistics with AI
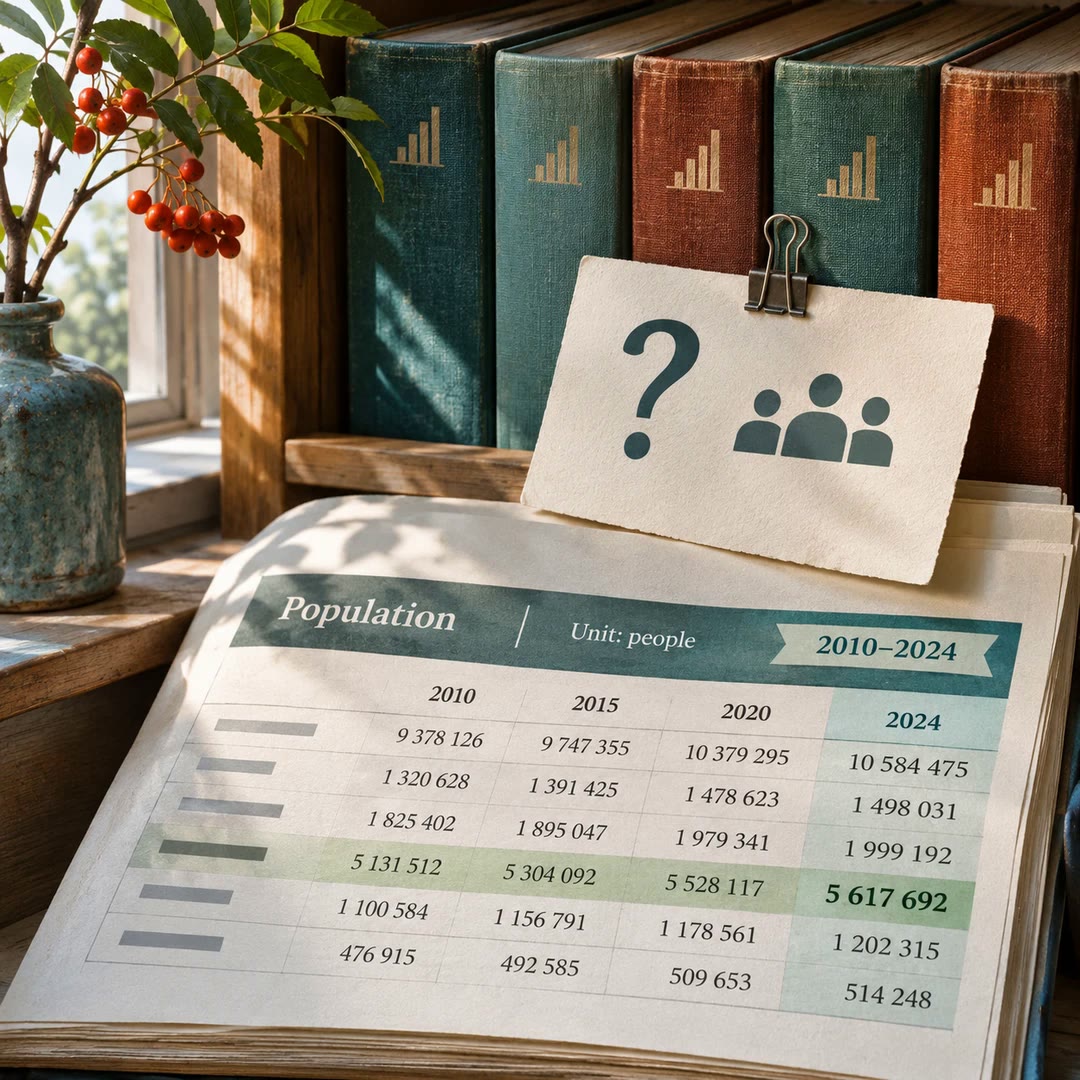
Ask a specific question of a PxWebApi v2 statistics service. Get the figures with the table, units and time period needed to quote them accurately.
Free - SkillNew
Review astrophotography data with AI
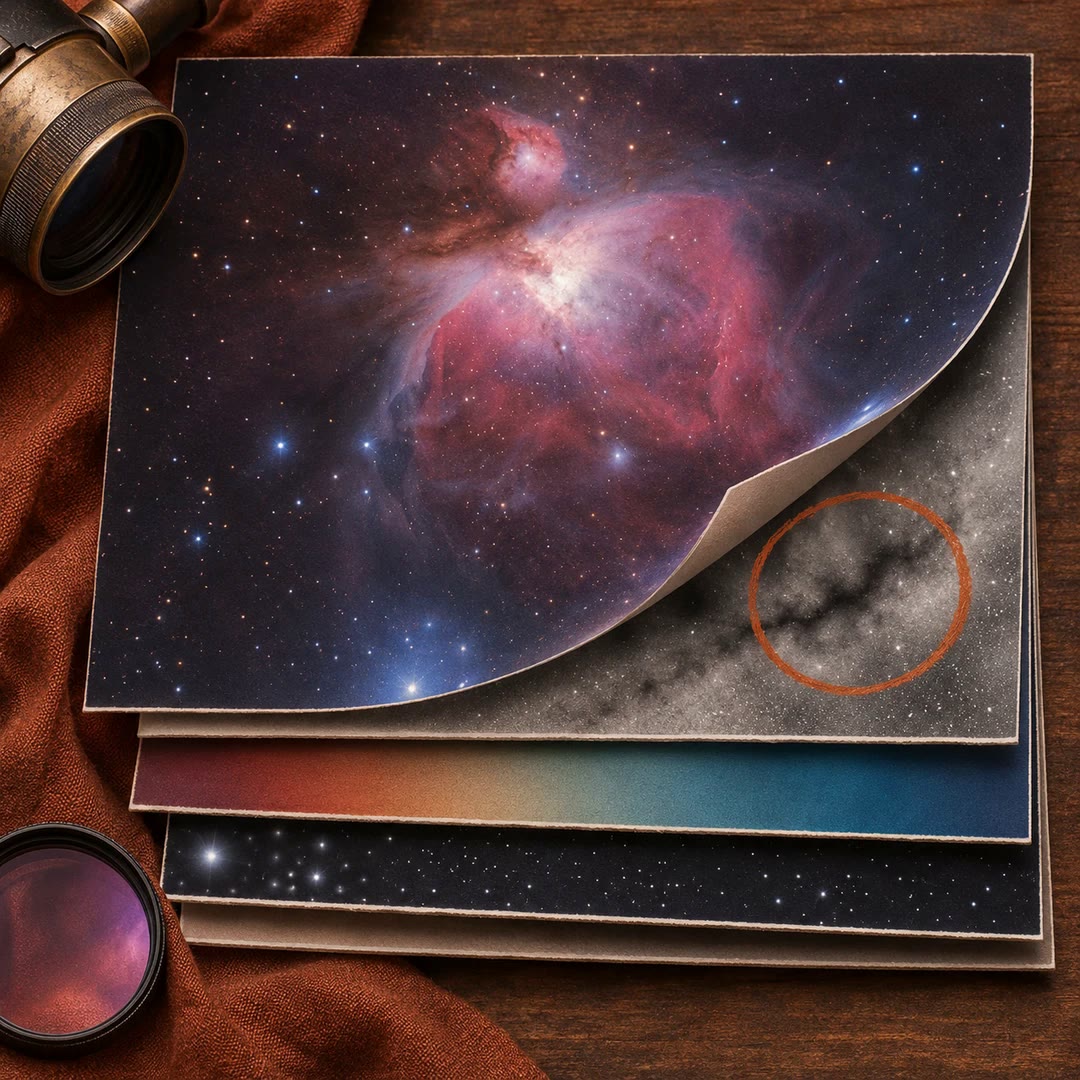
Work out which stage to revisit when a stack has dust shadows, uneven colour or stars that look different across the frame.
Free