Analyse large tables with AI
Ask a question about a local CSV or Parquet file and get a supporting table with a repeatable Python calculation.
Analyse large tables with AI when a single total hides the detail you need. A lending library might want the proportion of items returned late for each branch, quarter by quarter. With polars, your agent can inspect the available dates and categories, agree on a definition of late, and return a small comparison table backed by a repeatable Python calculation.
A branch with three loans deserves a different reading from one with three thousand. Ask for the number of loans beneath each percentage. If the source has missing return dates, decide whether open loans belong in the denominator. The calculation can select the needed fields and build its filters and groups before requesting the result.
What it does
- Compare periods using a stated denominator and complete date ranges.
- Keep group counts next to averages or rates so small samples stand out.
- Join a catalogue to a transaction file using the agreed record key.
- Parse dates and mark missing values when reading a CSV.
- Inspect a query plan when a calculation processes far more data than expected.
Install and use
- Use Python 3.10 or later with Polars installed. Supply an authorised table or a representative anonymised subset.
- Define the time window, the measure and your treatment of missing entries.
- Ask for the supporting counts, then cross-check one group before reusing the calculation.
FAQ
Source
Made by Polars. Original skill: polars, published on GitHub under the MIT licence.
View on GitHubRelated products
- SkillNew
Estimate your carbon footprint with AI
Use your own bills and receipts to build an emissions range, retain the source behind each figure and compare changes without hiding uncertainty.
Free - SkillNew
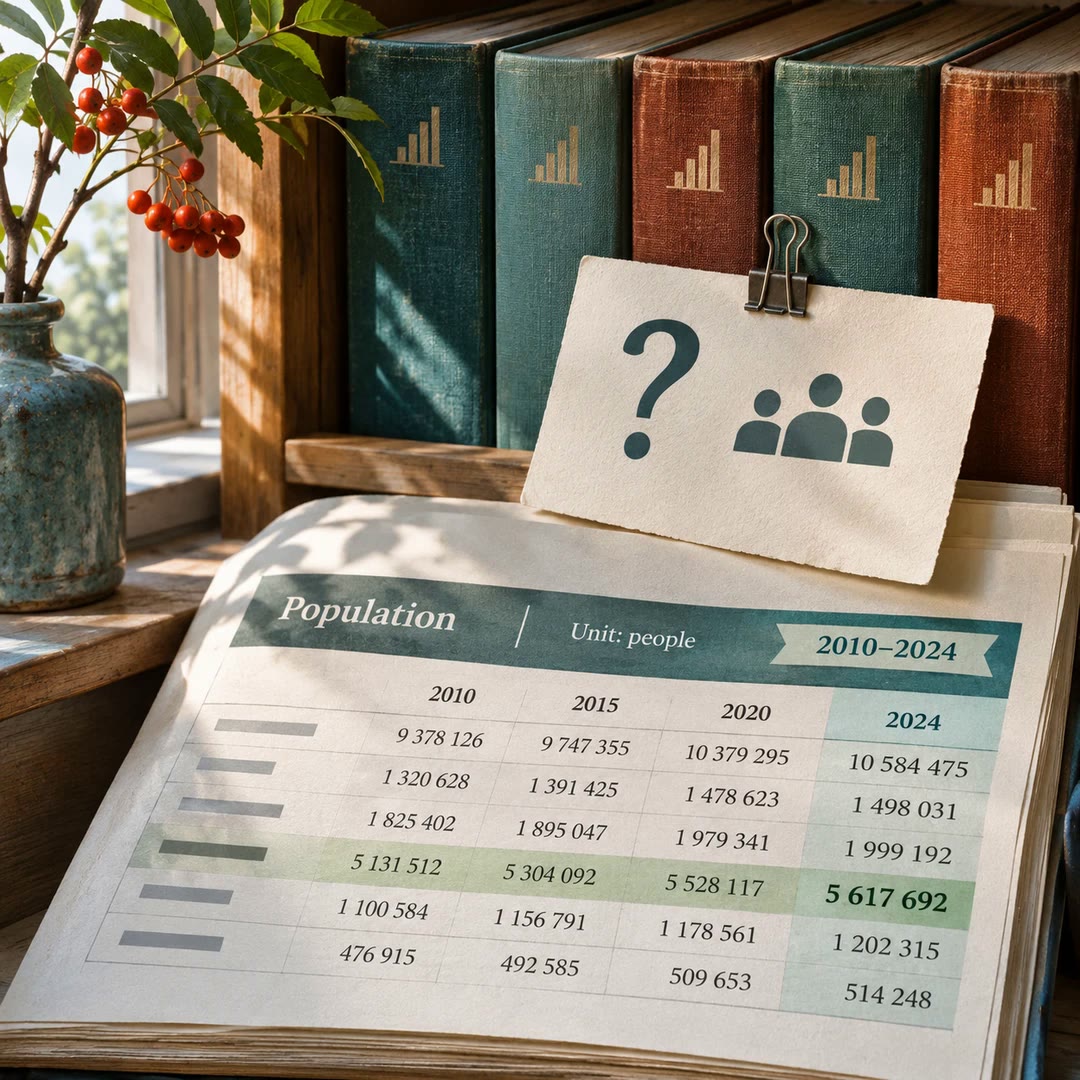
Find official statistics with AI
Ask a specific question of a PxWebApi v2 statistics service. Get the figures with the table, units and time period needed to quote them accurately.
Free - SkillNew
Review astrophotography data with AI
Work out which stage to revisit when a stack has dust shadows, uneven colour or stars that look different across the frame.
Free