Analyse store performance with AI
Compare like-for-like periods, locate changes by product group and distinguish supported explanations from questions that need more evidence.
To analyse store performance with AI, first establish that the reported change is real. The first three days of this week and seven days of last week are a poor comparison unless the difference is explicit. The performance-insights guide retrieves store measures and checks the period, baseline and segment behind a headline number.
Average order value can fall even when every price stays unchanged, simply because more buyers chose cheaper products. Look at the mix before blaming a promotion. Stock shortages, campaign dates and category performance provide possible explanations, each of which needs evidence from the same period.
What it does
- Compare sales over matching periods
- Find the segment contributing most to a change
- Distinguish product mix from a price movement
- Assess pace against a stated business target
- Identify the missing evidence behind a possible cause
Install and use
- Install the skill within an official Merchant Agent deployment connected to the store’s authorised metrics and model tools. The baseline series must be available for a direct comparison.
- Ask “Compare sales to Tuesday with the same days last week. Which category accounts for the movement, and can you distinguish price from mix?”
- Check dates and sources. Where evidence is incomplete, retain the explanation as a lead and identify the next useful query.
FAQ
Source
Made by Anthropic. Original skill: performance-insights, published on GitHub under the Apache-2.0 licence.
View on GitHubRelated products
- SkillNew
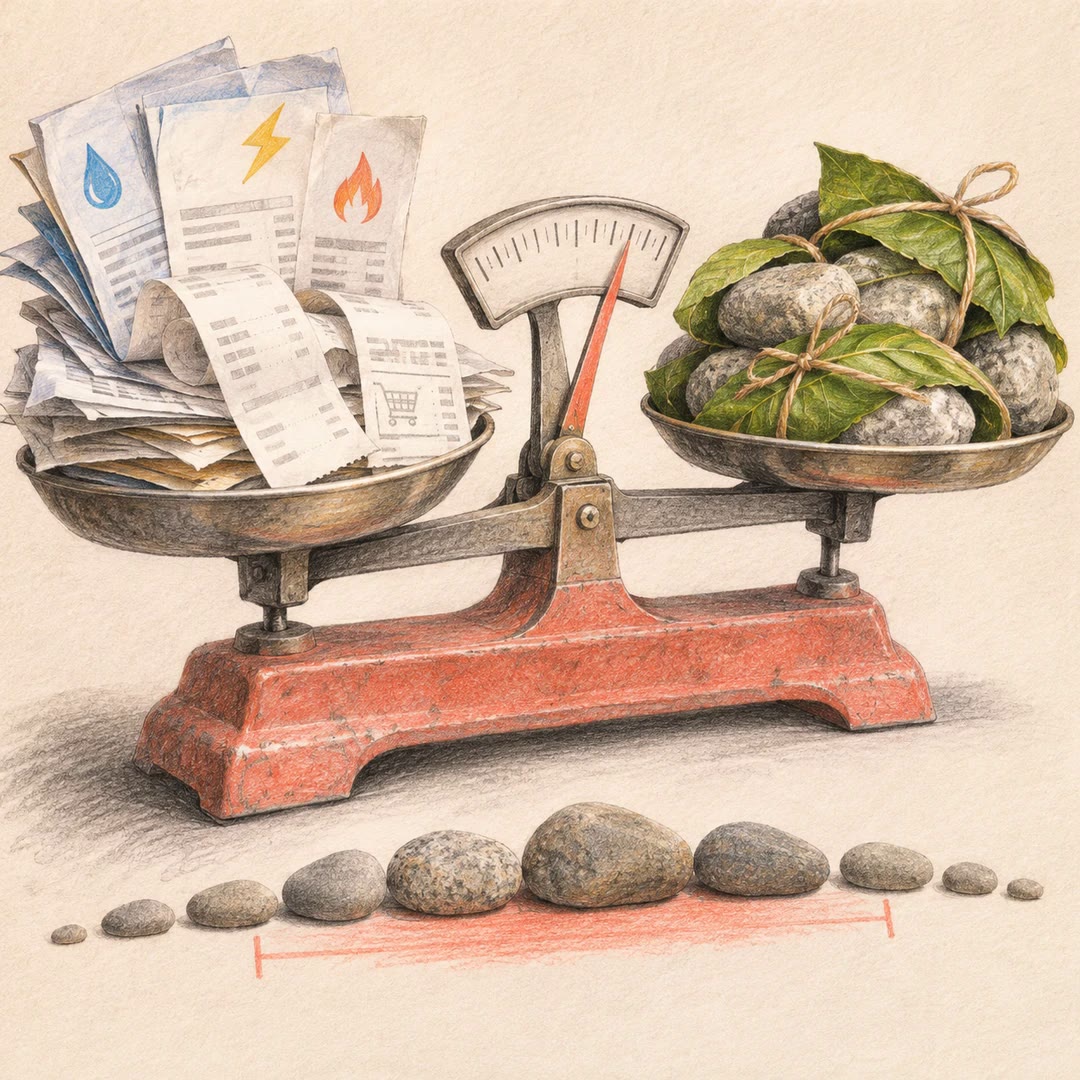
Estimate your carbon footprint with AI
Use your own bills and receipts to build an emissions range, retain the source behind each figure and compare changes without hiding uncertainty.
Free - SkillNew
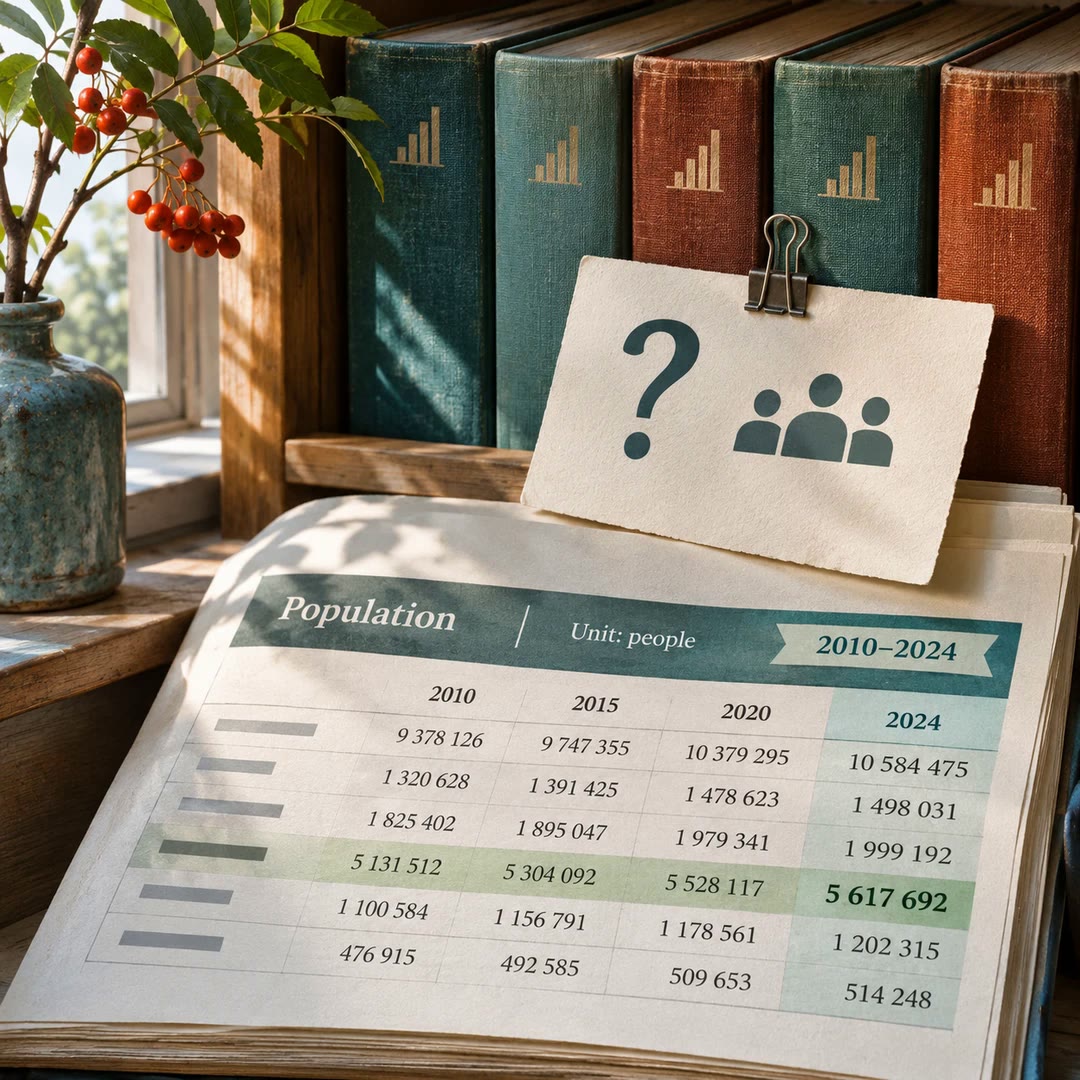
Find official statistics with AI
Ask a specific question of a PxWebApi v2 statistics service. Get the figures with the table, units and time period needed to quote them accurately.
Free - SkillNew
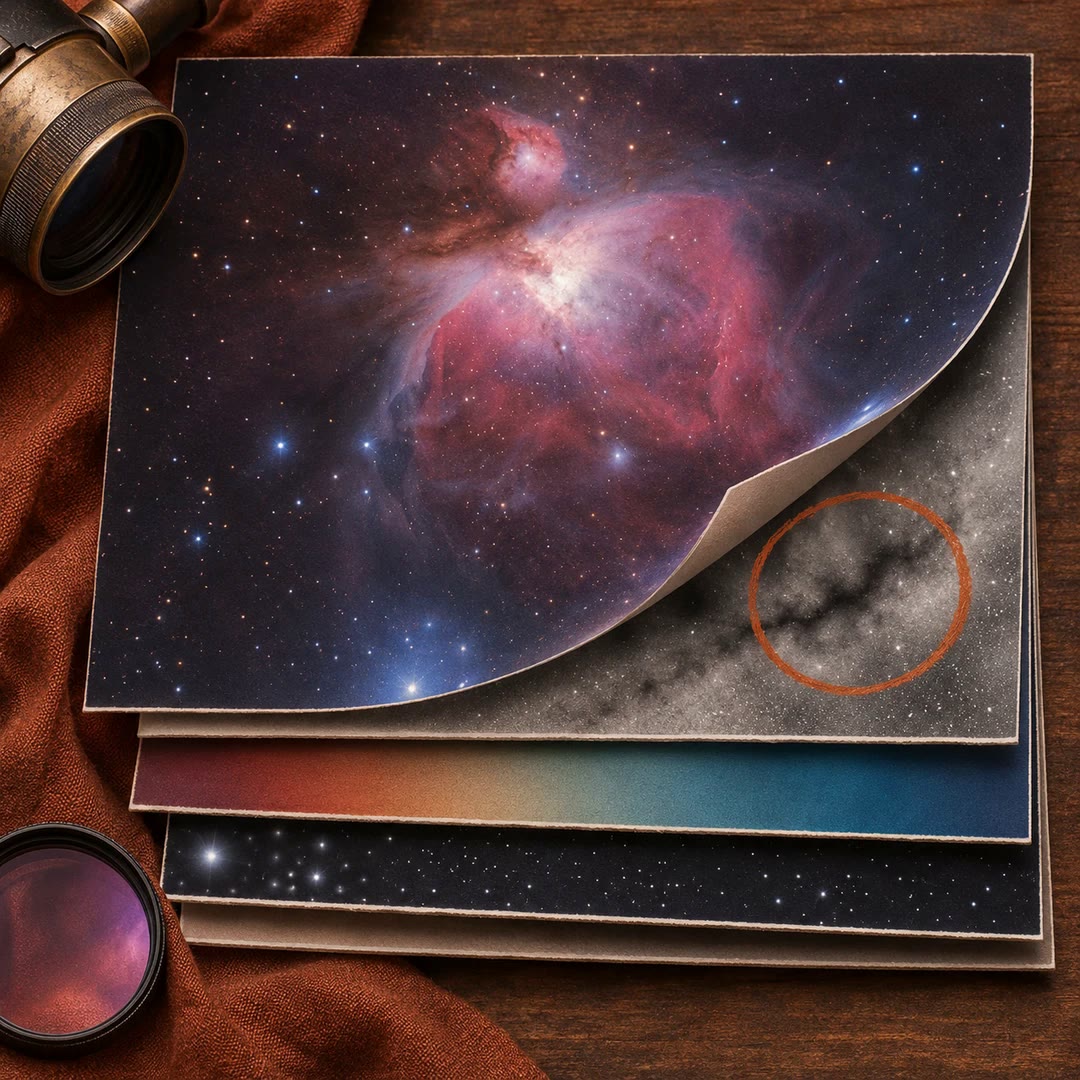
Review astrophotography data with AI
Work out which stage to revisit when a stack has dust shadows, uneven colour or stars that look different across the frame.
Free