Explore tide station data with AI
Compare a NOAA tide prediction with measured water levels and nearby buoy observations, retaining the station, datum, units and observation time.
To explore tide station data with AI, begin by deciding which height interests you. A gauge may report how high the harbour water stood above a specified datum, while a buoy offshore reports waves moving across the surface. The noaa-marine-guide skill selects the relevant NOAA station and explains which service produced each value.
For a coastal field notebook, you might compare the water level predicted that morning with the level actually observed. Keep the station and time basis consistent. If an observation is missing, check whether the site even has a gauge: a prediction station alone cannot supply measured levels.
What it does
- Choose a CO-OPS station that has the observation or prediction capability you need.
- Compare predicted and measured water levels against the same datum.
- Read the observation time on a buoy report before describing current conditions.
- Distinguish the timing of high water from the timing of a tidal current.
- Assemble a sequence of monthly means with consistent units and reference levels.
Install and use
- Install the skill in your agent and connect the maker’s NOAA Marine MCP server. Public data queries need internet access and no NOAA key.
- Give a station ID or coordinates in the coverage area and specify a date range.
- Inspect units, timestamps and datum together. Use official marine forecasts and warnings for travel decisions.
FAQ
Source
Made by cyanheads. Original skill: noaa-marine-guide, published on GitHub under the Apache-2.0 licence.
View on GitHubRelated products
- SkillNew
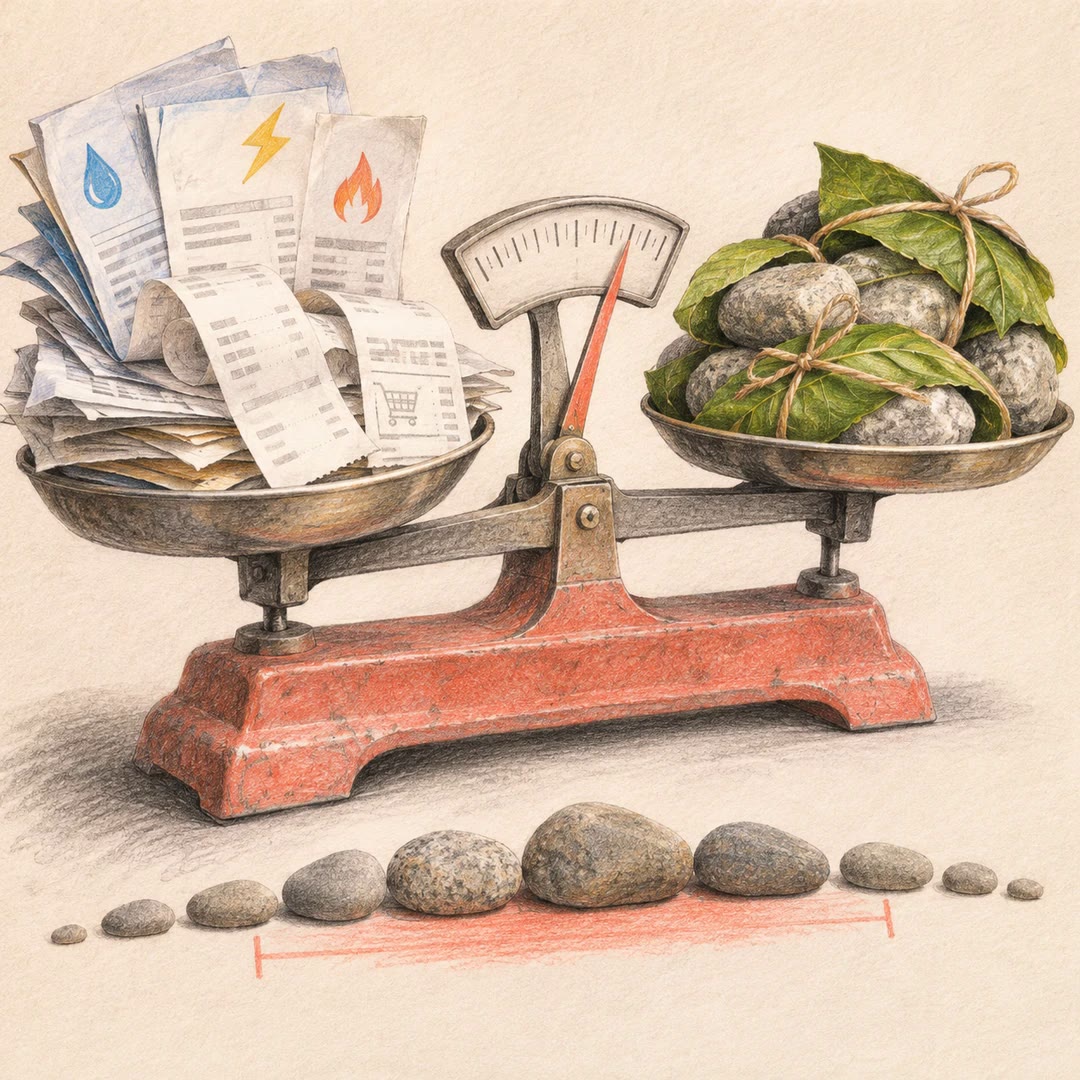
Estimate your carbon footprint with AI
Use your own bills and receipts to build an emissions range, retain the source behind each figure and compare changes without hiding uncertainty.
Free - SkillNew
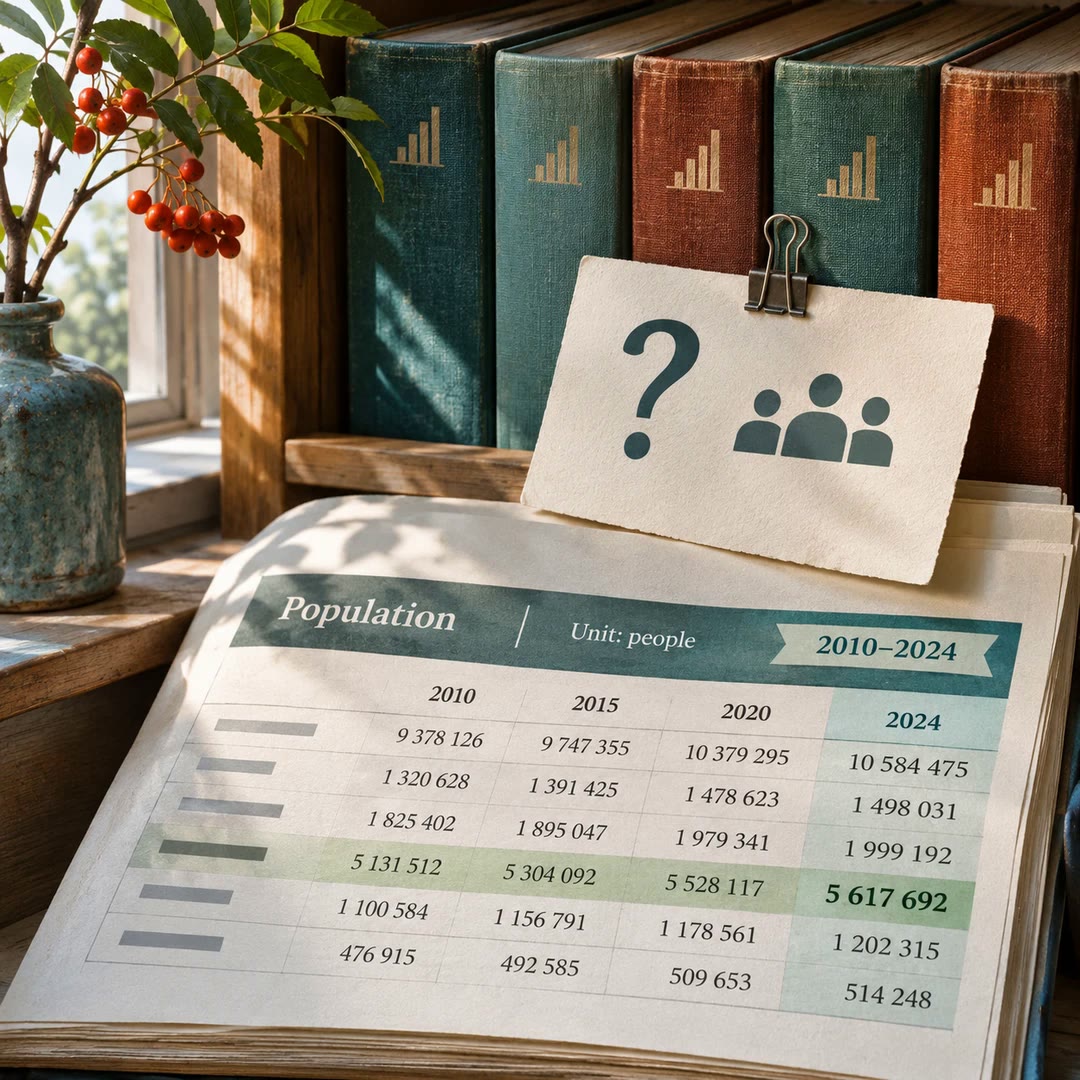
Find official statistics with AI
Ask a specific question of a PxWebApi v2 statistics service. Get the figures with the table, units and time period needed to quote them accurately.
Free - SkillNew
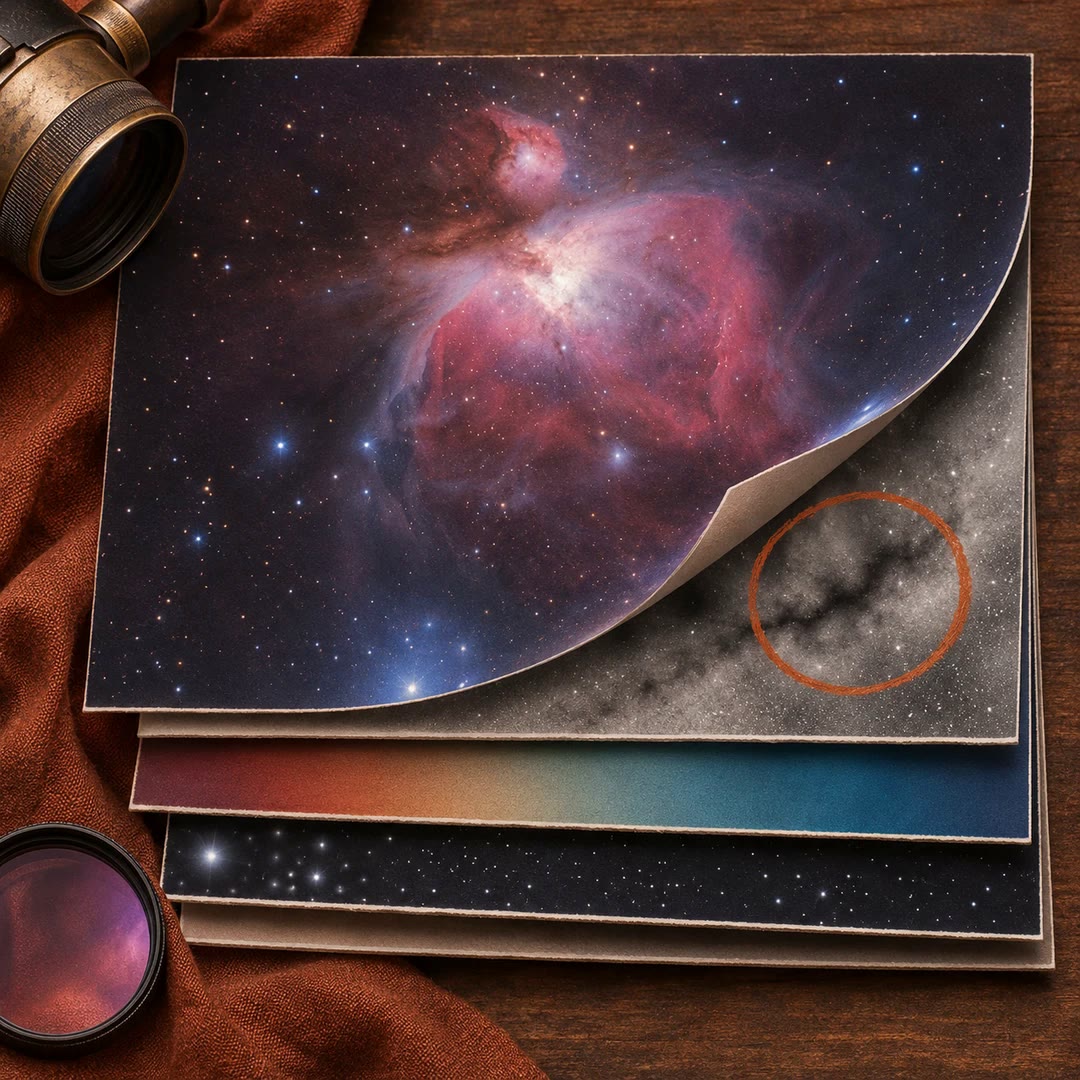
Review astrophotography data with AI
Work out which stage to revisit when a stack has dust shadows, uneven colour or stars that look different across the frame.
Free