Run Google Analytics reports with AI
Build a report for one property with the dates, dimensions and metrics that answer a specific question, such as active users by day or city.
Run Google Analytics reports with AI when a colleague asks a narrow question such as how many active users visited each day last week. The google-analytics-data-api-basics skill guides an agent through an official reporting request. It helps specify the property, dates, metric and the dimension that will define each row.
A table grouped by city answers a different question from one grouped by date. Even with the same property and week, counting views rather than users changes what the figures mean. Deciding on those fields first makes the resulting table easier to check against the Analytics interface or reuse in a dashboard.
What it does
- Retrieve active user counts for an authorised property and date range.
- Group a metric by city when the audience breakdown is relevant.
- Use a date dimension to inspect daily changes hidden in a weekly total.
- Check that the desired dimension and metric can be combined in one report.
- Prepare a small, repeatable report in the project’s existing programming language.
Install and use
- Provide the property ID and read permission. Use a Cloud project with the Analytics Data API enabled and its official client library.
- Ask, “Return a table of active users by date for last week and include the period and property you queried.”
- Compare the numbers with the same metric, dates and grouping in Analytics before sharing them.
FAQ
Source
Made by Google. Original skill: google-analytics-data-api-basics, published on GitHub under the Apache-2.0 licence.
View on GitHubRelated products
- SkillNew
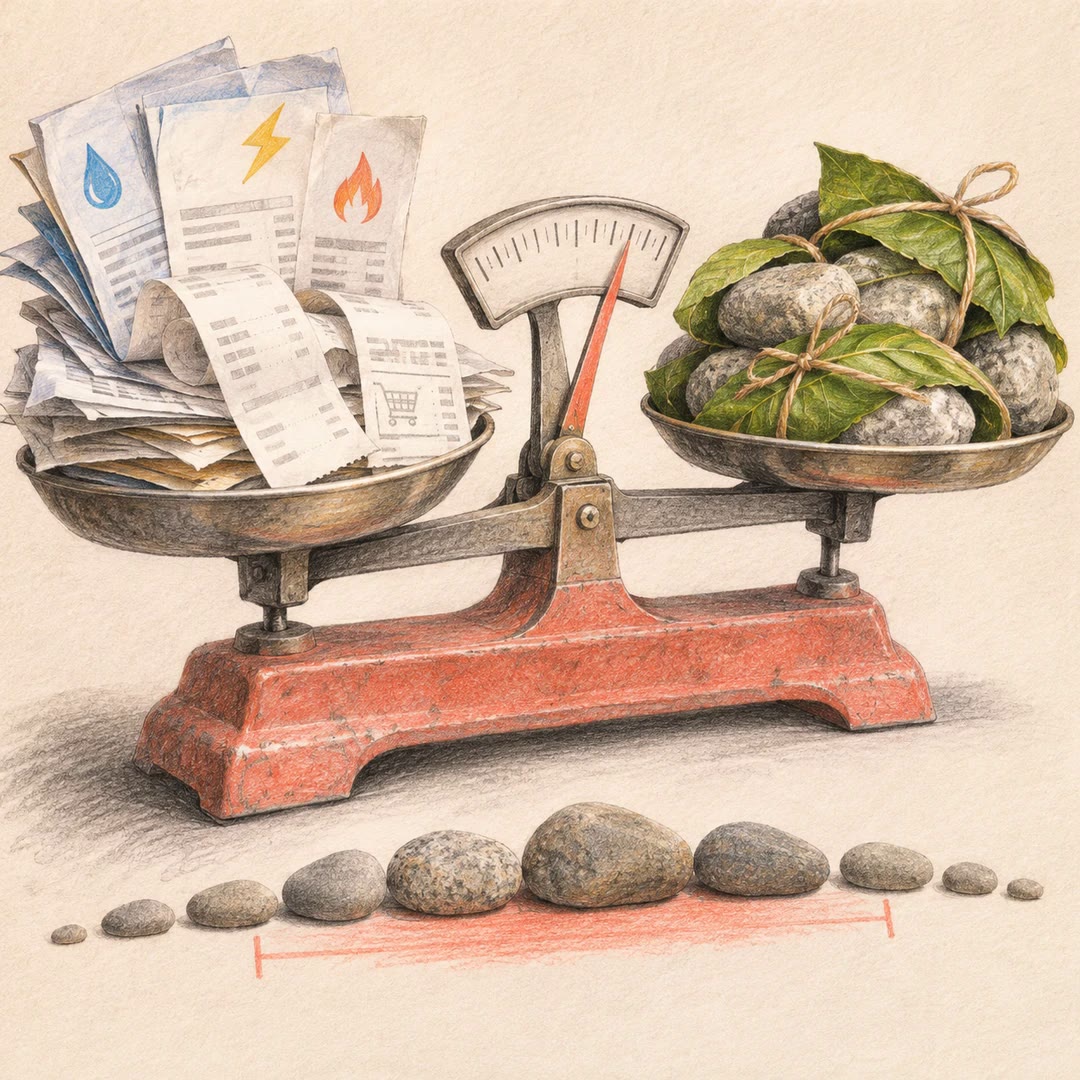
Estimate your carbon footprint with AI
Use your own bills and receipts to build an emissions range, retain the source behind each figure and compare changes without hiding uncertainty.
Free - SkillNew
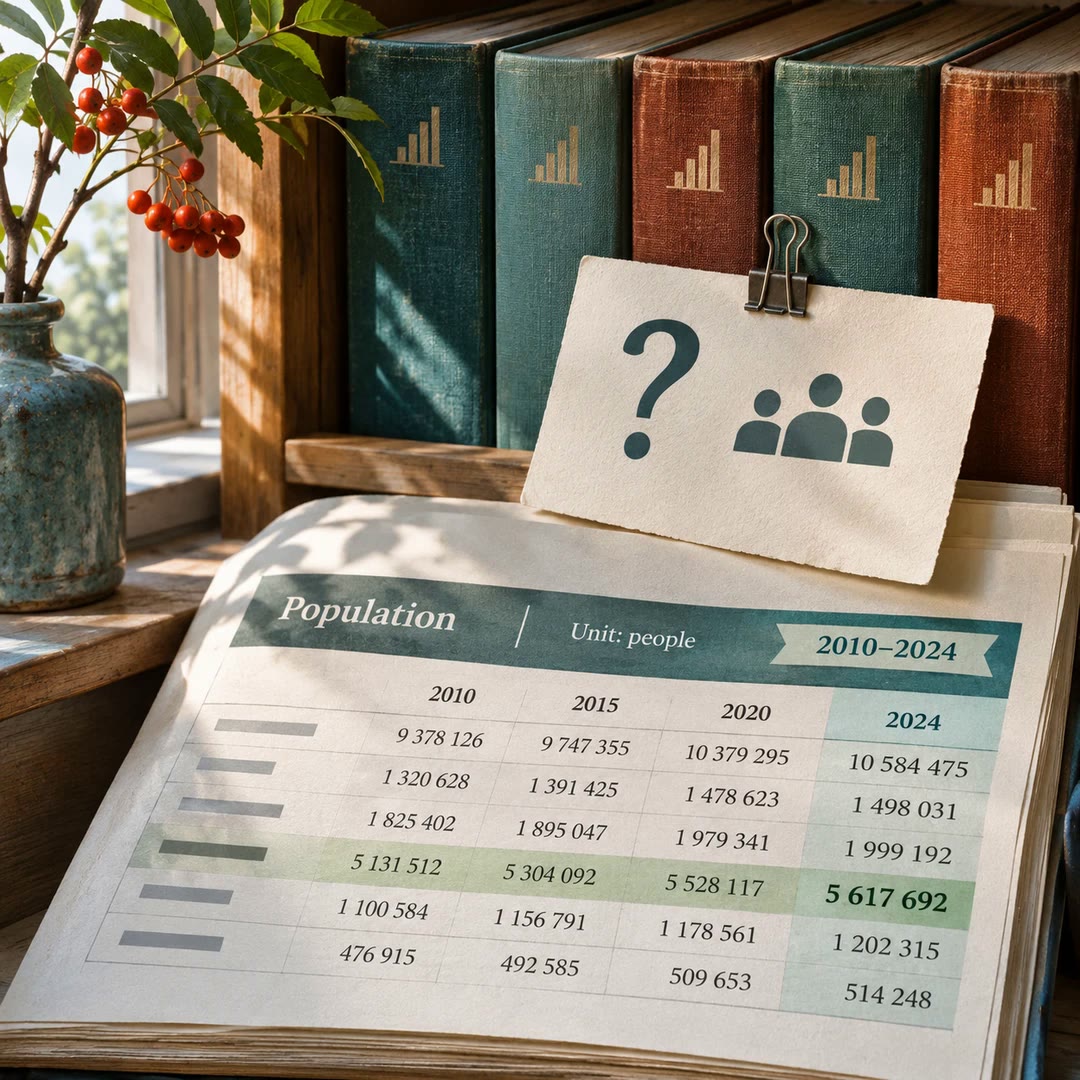
Find official statistics with AI
Ask a specific question of a PxWebApi v2 statistics service. Get the figures with the table, units and time period needed to quote them accurately.
Free - SkillNew
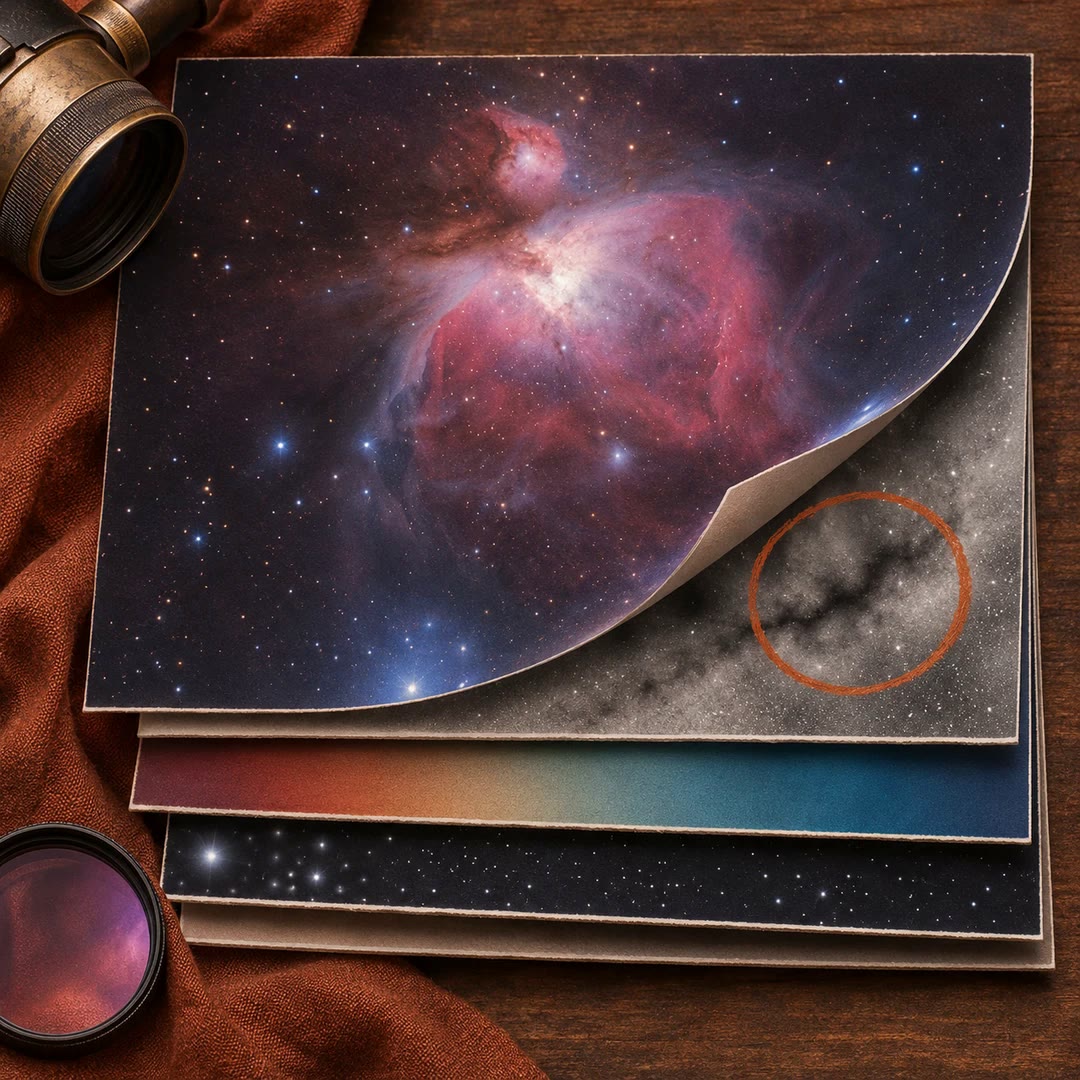
Review astrophotography data with AI
Work out which stage to revisit when a stack has dust shadows, uneven colour or stars that look different across the frame.
Free