Compare European statistics with AI
Find a Eurostat dataset, inspect what its rows measure and compare countries or regions with consistent units, periods and geographic levels.
To compare European statistics with AI, ask what a row represents before sorting by its value. A table might describe passenger journeys, passenger kilometres or the percentage of a population using a service. Those figures answer different questions. The eurostat-guide skill helps your agent find a dataset, inspect its dimensions and request a slice that fits the question.
Suppose a display includes a country and several regions within it. Adding the rows would count some activity twice. Resolve the geography codes and select one level before aggregation. If the table lacks a value for one period, preserve the gap and record what the remaining comparison covers.
What it does
- Find a dataset code and check the published definition behind its title.
- Use the same unit, period and indicator across a set of countries.
- Separate regional observations from totals that already include them.
- Attach readable labels to trade or regional codes before presenting a table.
- Check whether a large extraction was complete before treating it as a ranking.
Install and use
- Install the skill in your agent and connect the maker’s Eurostat MCP server. Public queries require internet access and no Eurostat key.
- State the comparison, then ask the agent to show the dimensions and coverage of its chosen table.
- Review a few labelled observations and include the dataset reference and period when reporting the result.
FAQ
Source
Made by cyanheads. Original skill: eurostat-guide, published on GitHub under the Apache-2.0 licence.
View on GitHubRelated products
- SkillNew
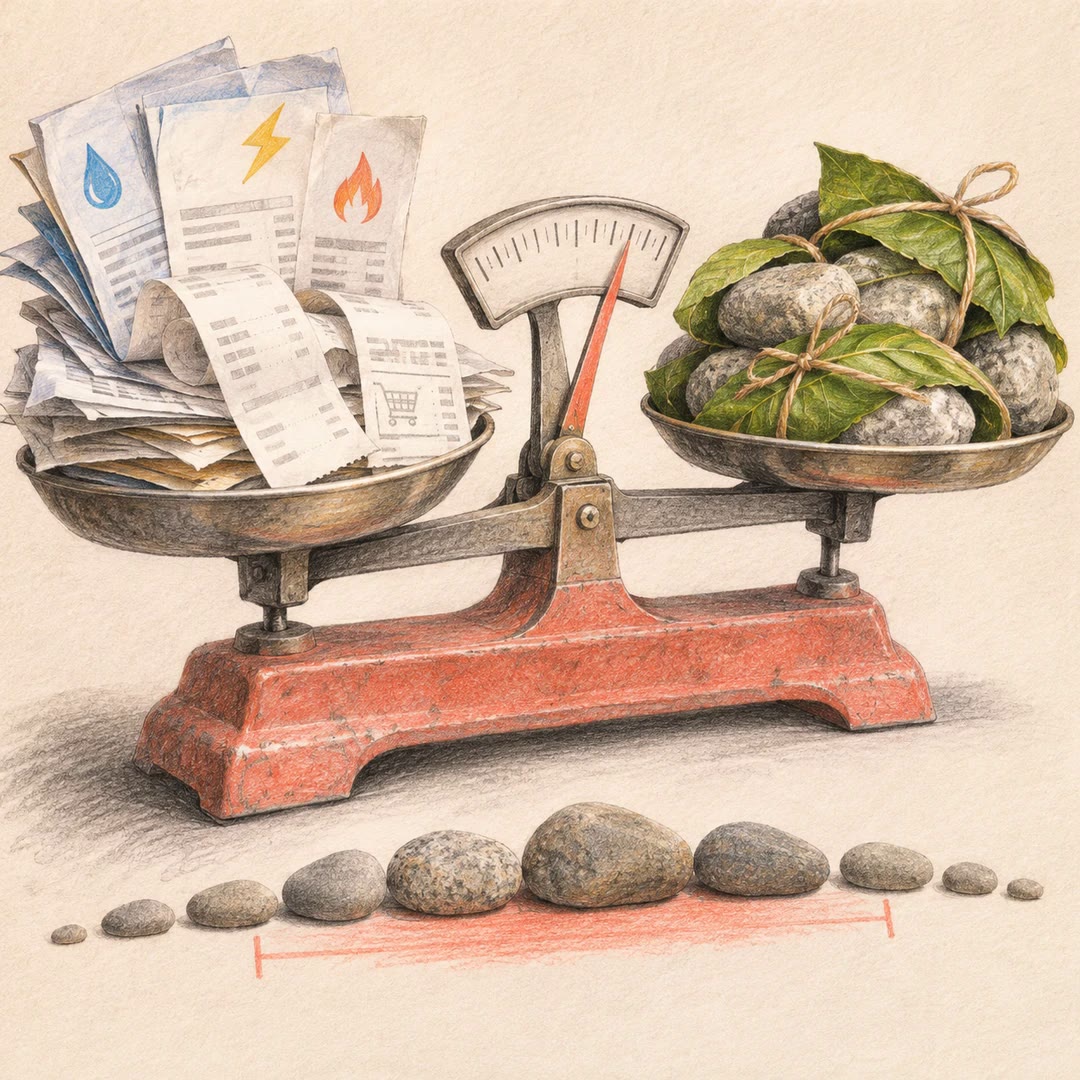
Estimate your carbon footprint with AI
Use your own bills and receipts to build an emissions range, retain the source behind each figure and compare changes without hiding uncertainty.
Free - SkillNew
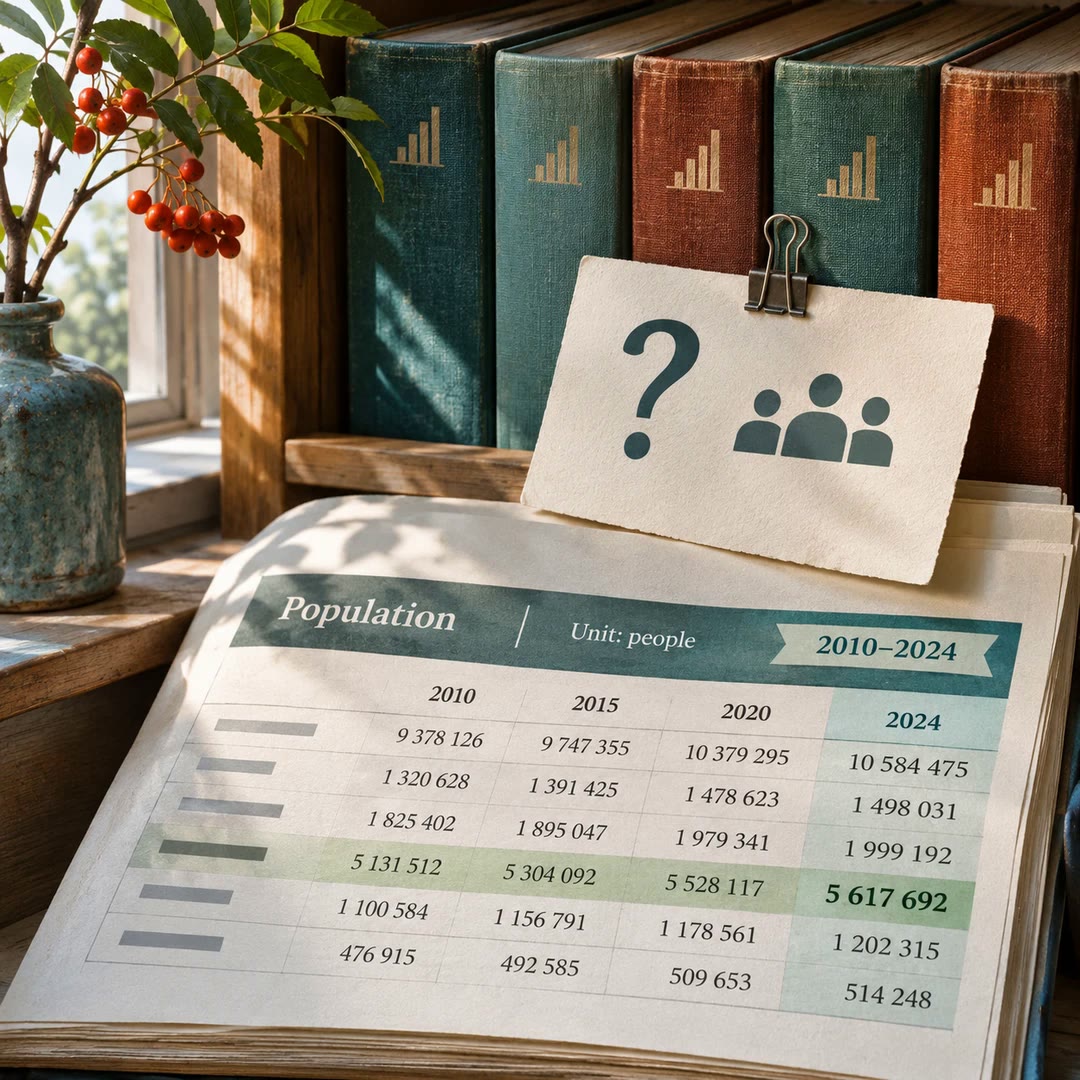
Find official statistics with AI
Ask a specific question of a PxWebApi v2 statistics service. Get the figures with the table, units and time period needed to quote them accurately.
Free - SkillNew
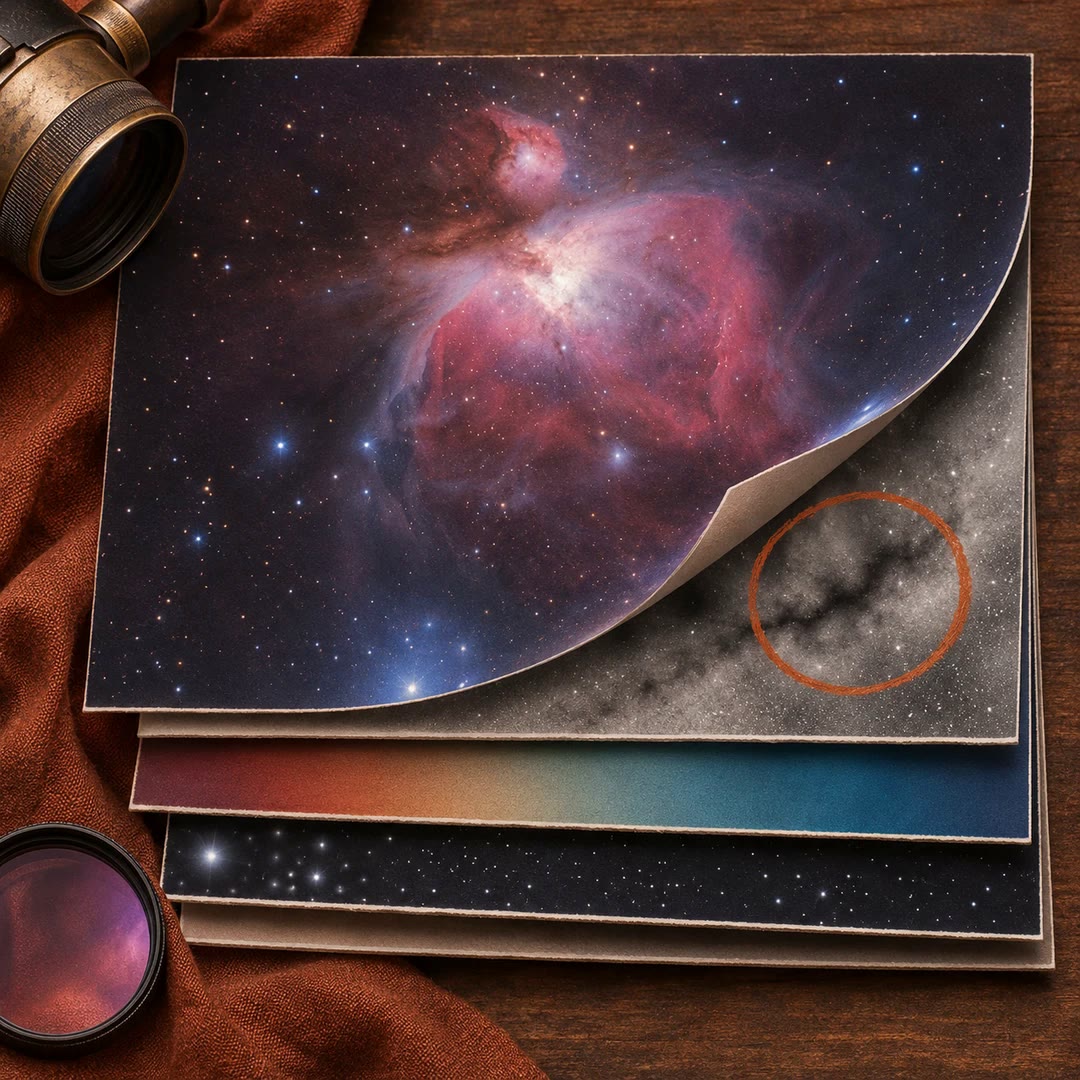
Review astrophotography data with AI
Work out which stage to revisit when a stack has dust shadows, uneven colour or stars that look different across the frame.
Free