Analyse a dataset with AI
Check what each row represents, choose a defensible comparison and report a result that someone else can reproduce.
Analyse a dataset with AI when an apparent increase or drop could change a decision. The data-analysis skill asks an agent to define the unit, denominator, comparison and useful outcome before calculating. It then checks missing values, duplicate rows and changes in measurement that could explain the result.
A support team might see more reports of an ordering problem after a busy week. The number of complaints is real, but it answers a different question from the proportion of orders affected. A relevant denominator and a comparable period make it easier to decide whether the issue worsened or volume simply grew.
What it does
- Define the population for a rate or percentage.
- Spot joins or duplicates that inflate totals.
- Check whether missing records come disproportionately from one group.
- Compare similar periods and document changes in collection.
- Keep the query, filters and assumptions beside the reported result.
Install and use
- Give an agent an authorised table and access to a local analysis or read-only query tool as needed. Explain the decision the result should inform.
- Ask it to compare one metric across two periods and show exactly how it counted the numerator and denominator.
- Check a handful of records manually and repeat the calculation with the saved filters.
FAQ
Source
Made by Arjun Prabhulal. Original skill: data-analysis, published on GitHub under the MIT licence.
View on GitHubRelated products
- SkillNew
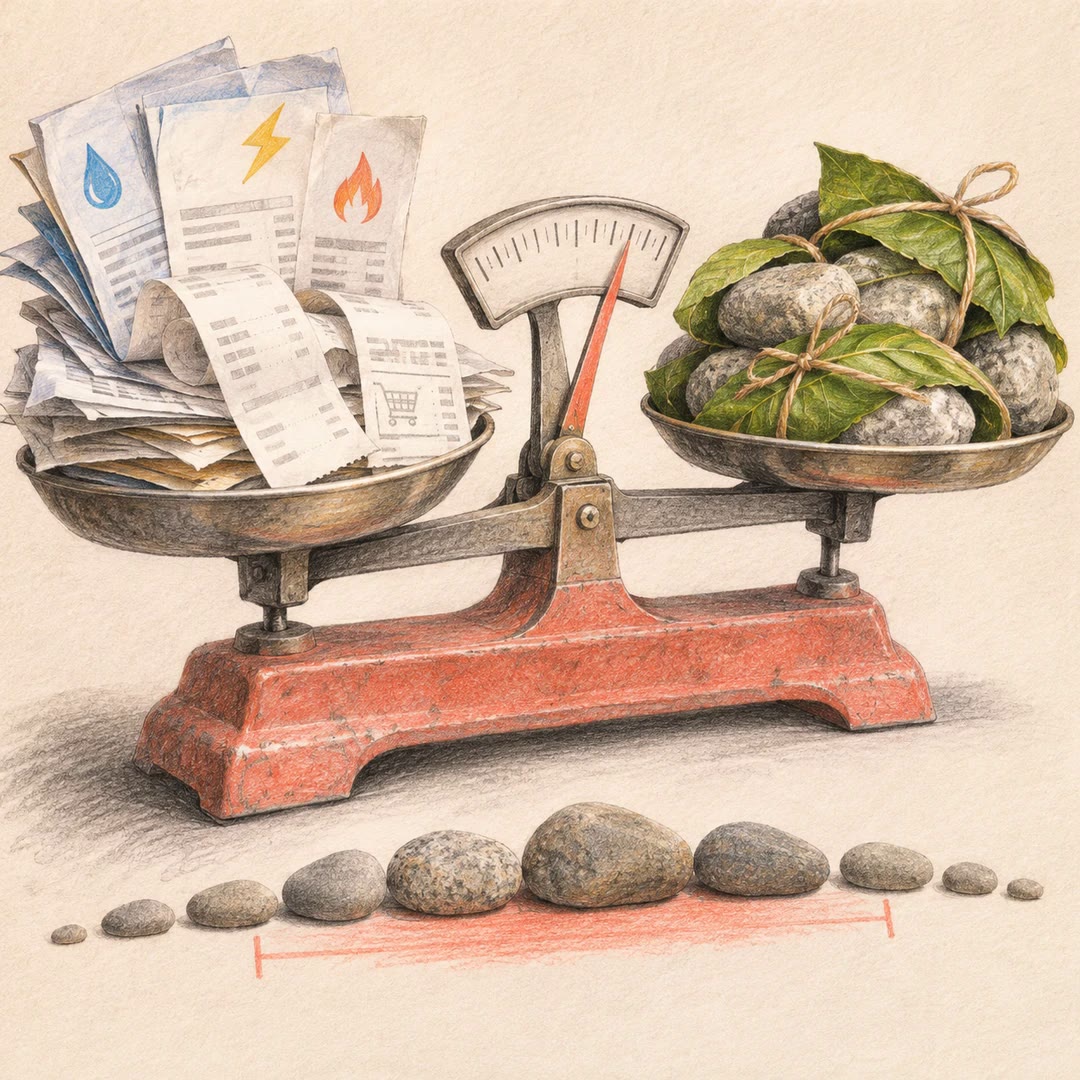
Estimate your carbon footprint with AI
Use your own bills and receipts to build an emissions range, retain the source behind each figure and compare changes without hiding uncertainty.
Free - SkillNew
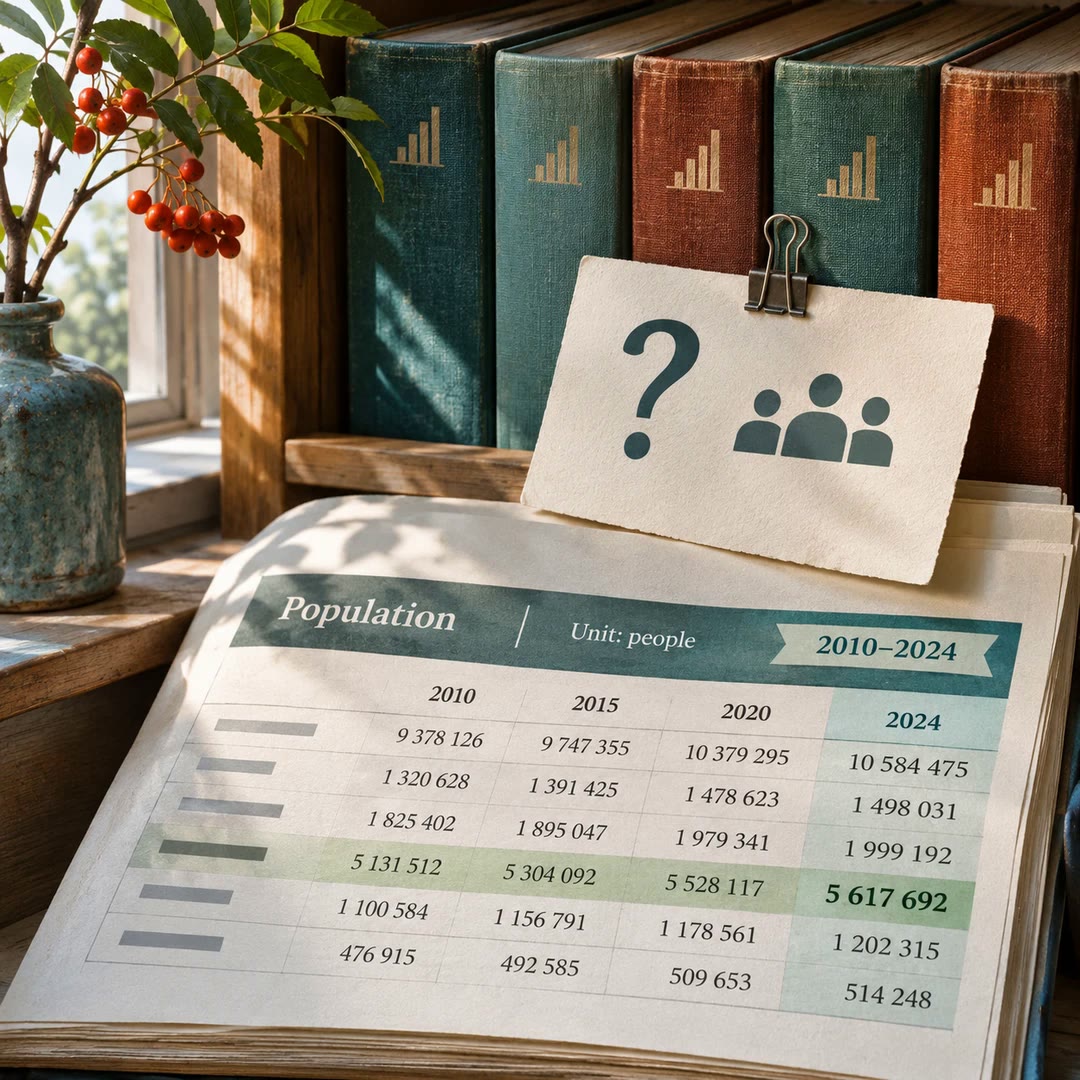
Find official statistics with AI
Ask a specific question of a PxWebApi v2 statistics service. Get the figures with the table, units and time period needed to quote them accurately.
Free - SkillNew
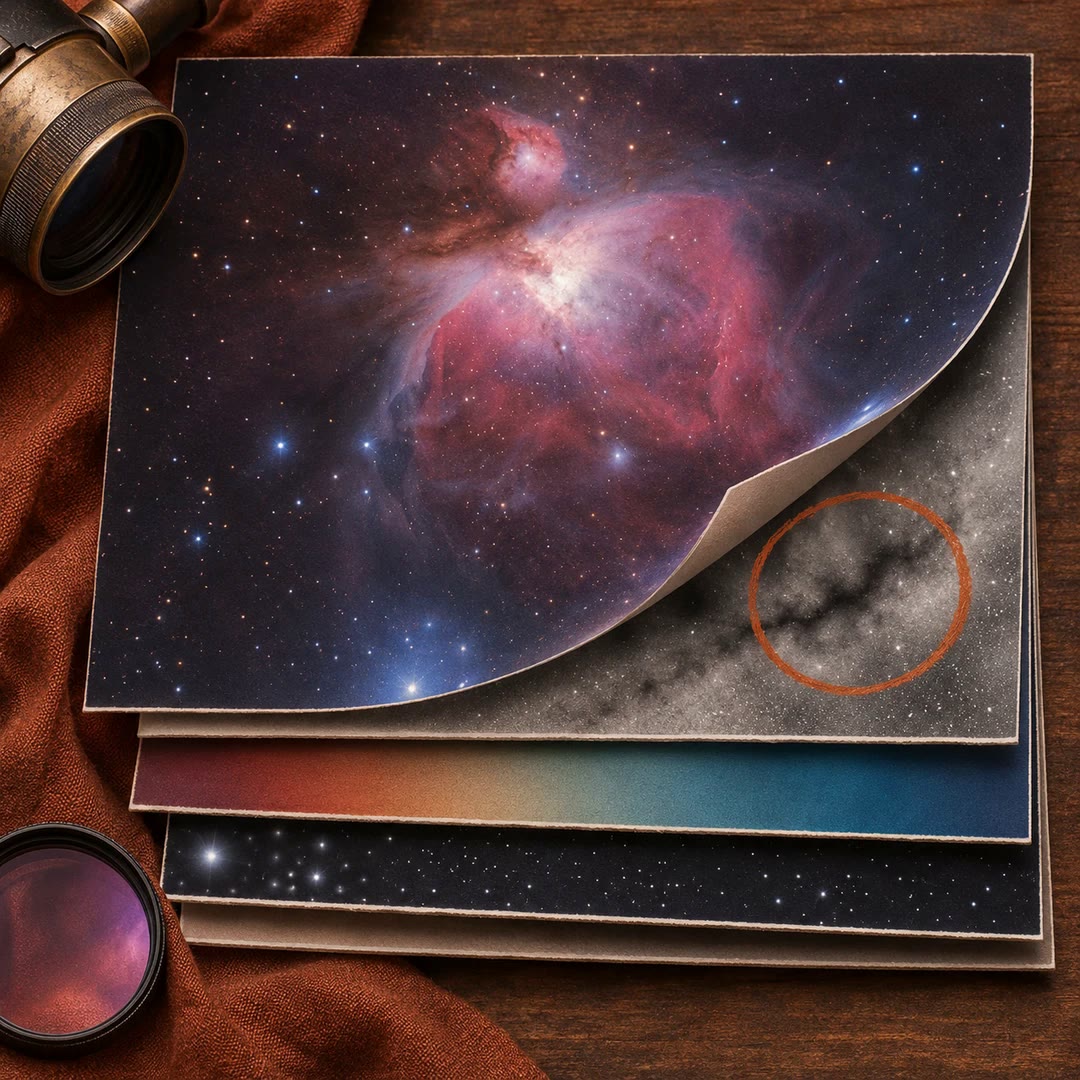
Review astrophotography data with AI
Work out which stage to revisit when a stack has dust shadows, uneven colour or stars that look different across the frame.
Free