Analyse an Excel file with AI
Ask a question about an authorised workbook, compare periods or categories and see the calculations and limitations behind the answer.
To analyse an Excel file with AI, start with a decision you need to make. If monthly revenue is down, a sales total cannot tell you whether order volume fell or the average order became smaller. The analyze guide can turn that question into comparisons using a workbook, pasted query results or an authorised table.
A small detail can overturn the comparison. This month may still be open, or the export may include cancelled orders at full value. Define the period, currency and order status before comparing product groups. A short answer can resolve one metric, while a fuller report can show the method, supporting figures and gaps.
What it does
- Compare sales over complete reporting periods
- Separate order volume from average order value
- Break a change down by product group
- Check missing values and reconcile subtotals
- Draft a report documenting the calculation and its limits
Install and use
- Install the Data plugin in a compatible agent and supply a permitted workbook, CSV or pasted table. A live warehouse query requires an authorised connector.
- Ask “Compare the last two complete months by product group. Show order count and average value, excluding cancelled orders.”
- Check the totals against the reporting source and ask how missing categories affect the conclusion.
FAQ
Source
Made by Anthropic. Original skill: analyze, published on GitHub under the Apache-2.0 licence.
View on GitHubRelated products
- SkillNew
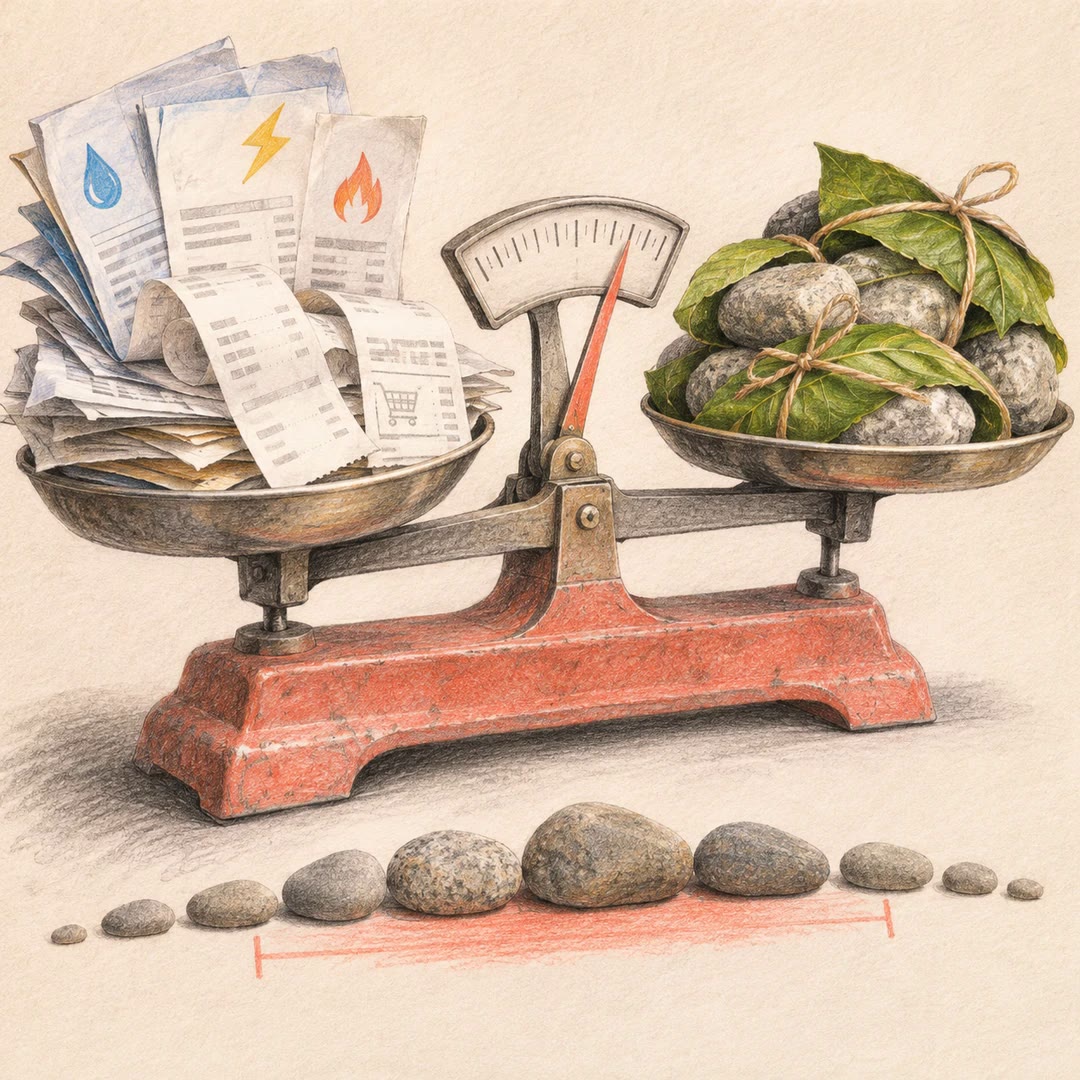
Estimate your carbon footprint with AI
Use your own bills and receipts to build an emissions range, retain the source behind each figure and compare changes without hiding uncertainty.
Free - SkillNew
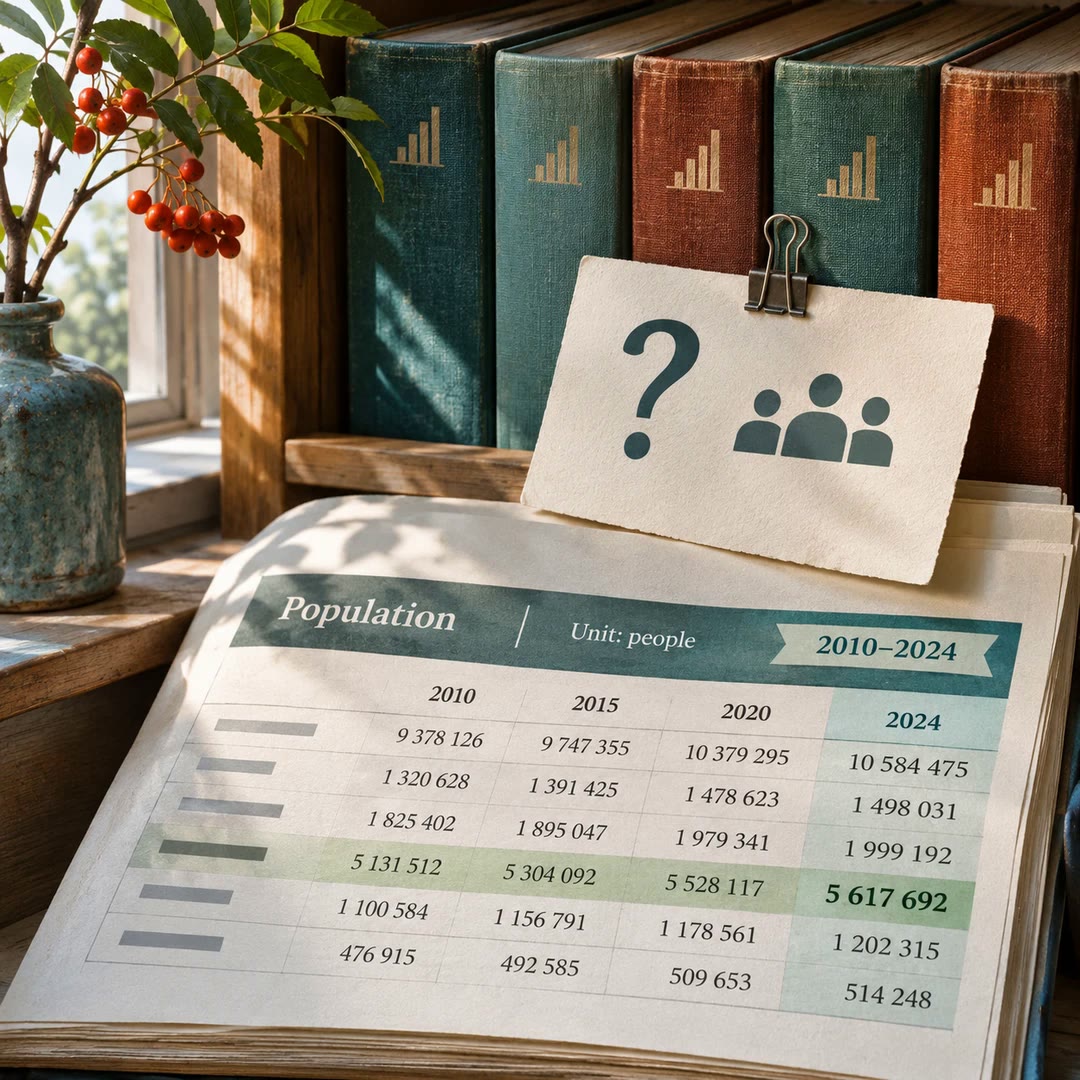
Find official statistics with AI
Ask a specific question of a PxWebApi v2 statistics service. Get the figures with the table, units and time period needed to quote them accurately.
Free - SkillNew
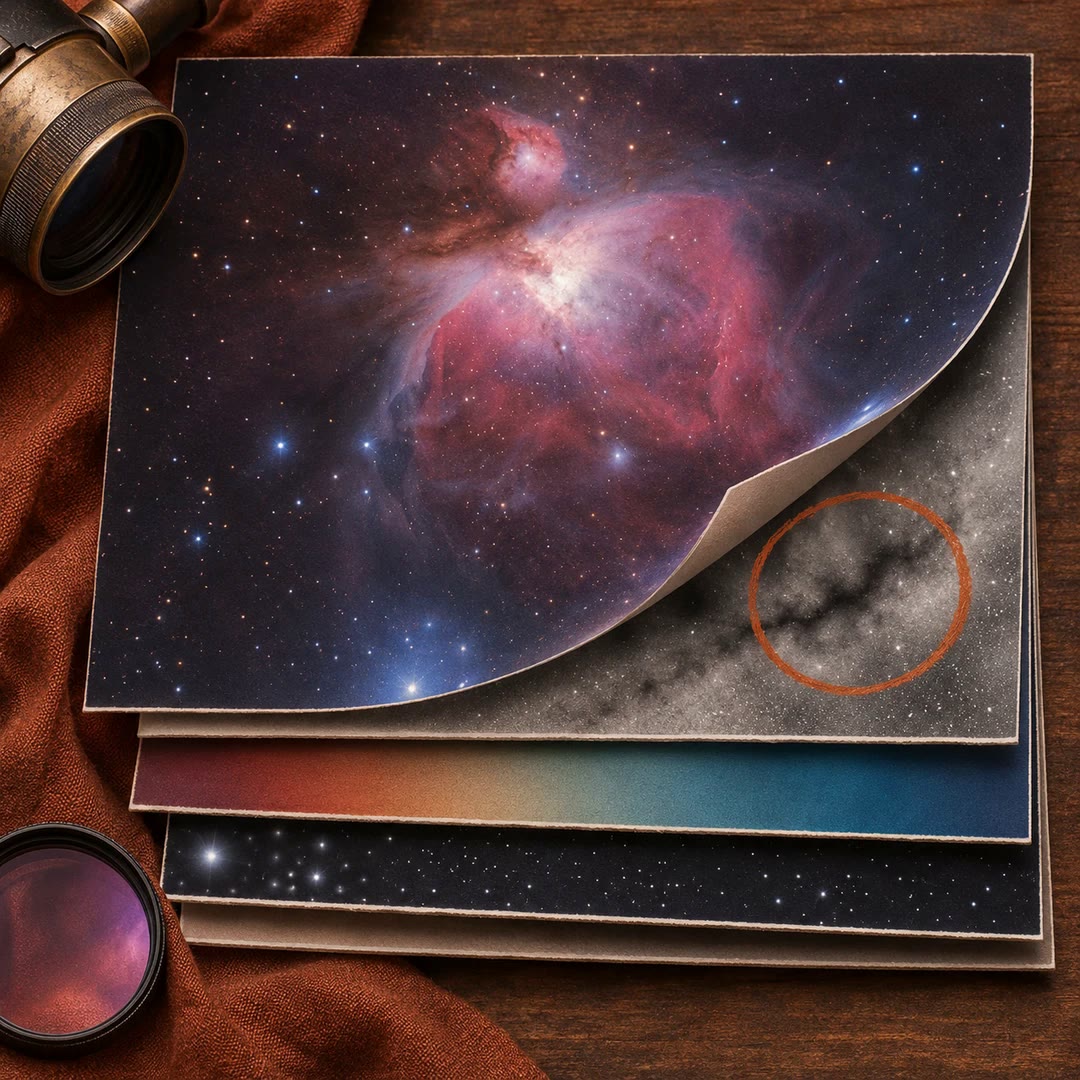
Review astrophotography data with AI
Work out which stage to revisit when a stack has dust shadows, uneven colour or stars that look different across the frame.
Free