Make an editable diagram with AI
Create an editable diagram for an article, meeting or presentation. Open the board in a local browser editor, adjust individual elements and export a visual copy.
To make an editable diagram with AI, decide what the reader needs to understand first. A service handover may call for a flowchart with a visible decision. A slide explaining why two teams share a dependency might work better as a composed visual with short labels.
The agentdraw skill leads from a drawing brief to an editable board. It can use Mermaid for structured relationships or an SVG composition for an explanatory image. The board opens in a local browser editor. Exported images can travel with a report while the source stays available for the next revision.
What it does
- Draw a workflow that makes a single decision and its outcomes easy to follow.
- Create an article illustration focused on a relationship that text alone leaves unclear.
- Prepare a slide visual with labels that remain readable at presentation size.
- Move an overlapping connector or rewrite a label in the local editor.
- Export an image for distribution and retain the editable board for future changes.
Install and use
- Install the skill and the official AgentDraw npm CLI, using a compatible Node runtime and a local browser.
- Ask, “Show this handover as an editable flowchart with one labelled decision and a clear owner on either side.”
- Open the board, inspect labels and connectors, then export an image and keep the editable source.
FAQ
Source
Made by AgentDraw (chen). Original skill: agentdraw, published on GitHub under the MIT licence.
View on GitHubRelated products
- SkillNew
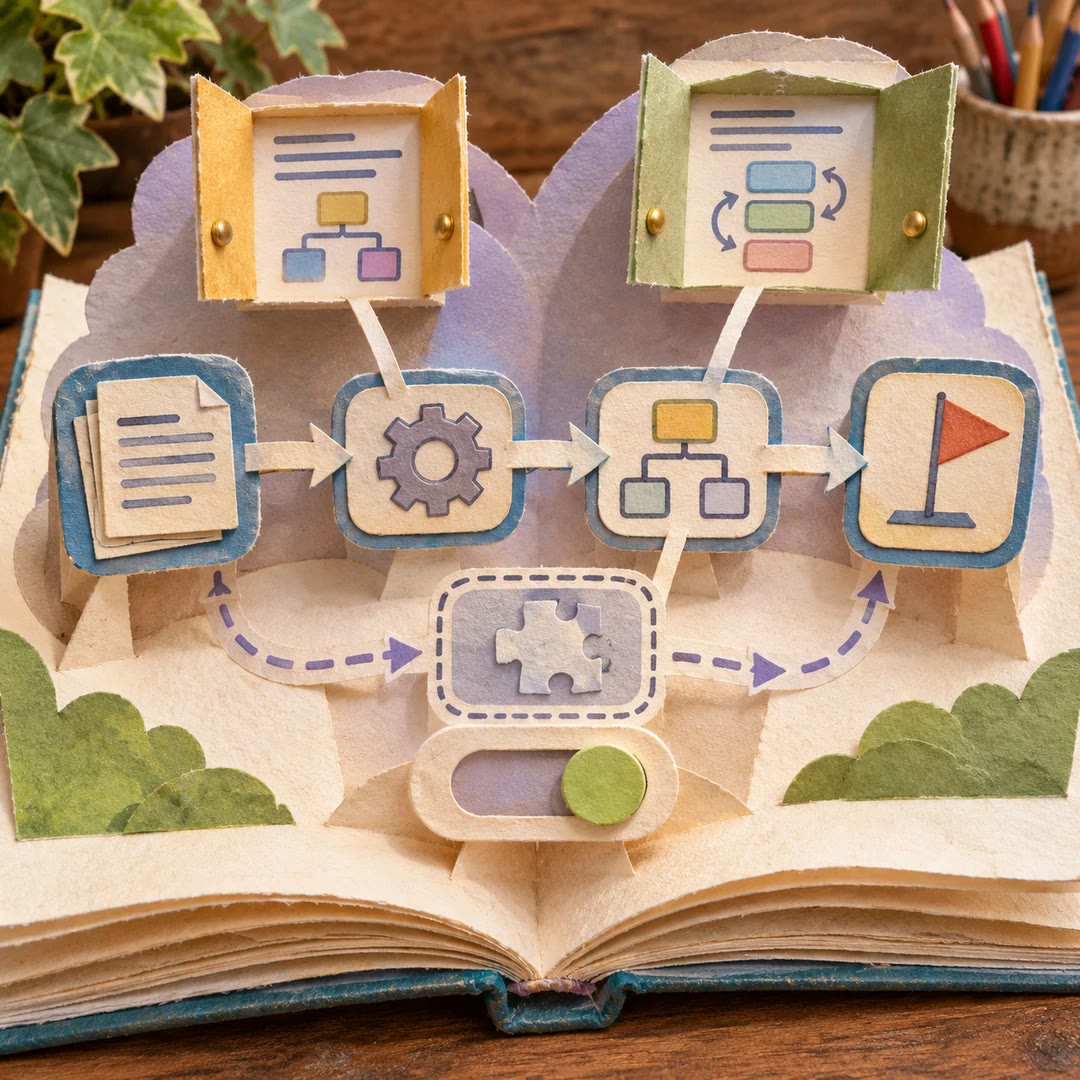
Create interactive diagrams with AI
Turn a process description into an editable HTML diagram with animated connections, detail windows and a switch for planned parts.
Free - SkillNew
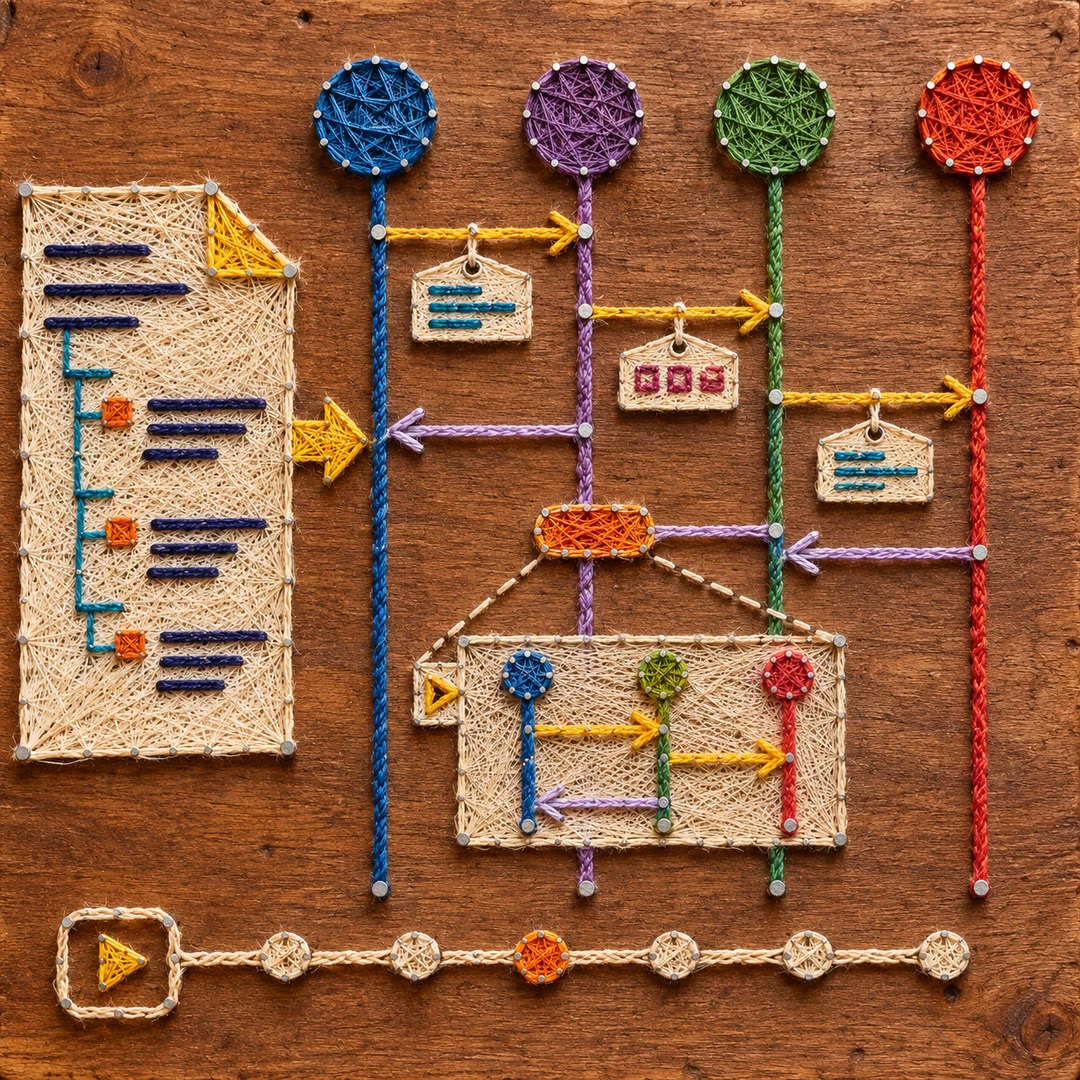
Draw data flows with openhop and AI
Describe a sequence in YAML and inspect it in a local step-through renderer, with messages, example data and expandable sub-flows.
Free - SkillNew
Create Chinese Xiaohongshu posts with AI
Arrange Chinese text into coordinated cover and content cards, then render and inspect PNGs from editable HTML templates.
Free