Create interactive flowcharts with AI
Turn a process description into a browsable diagram with steps, branches and clickable details
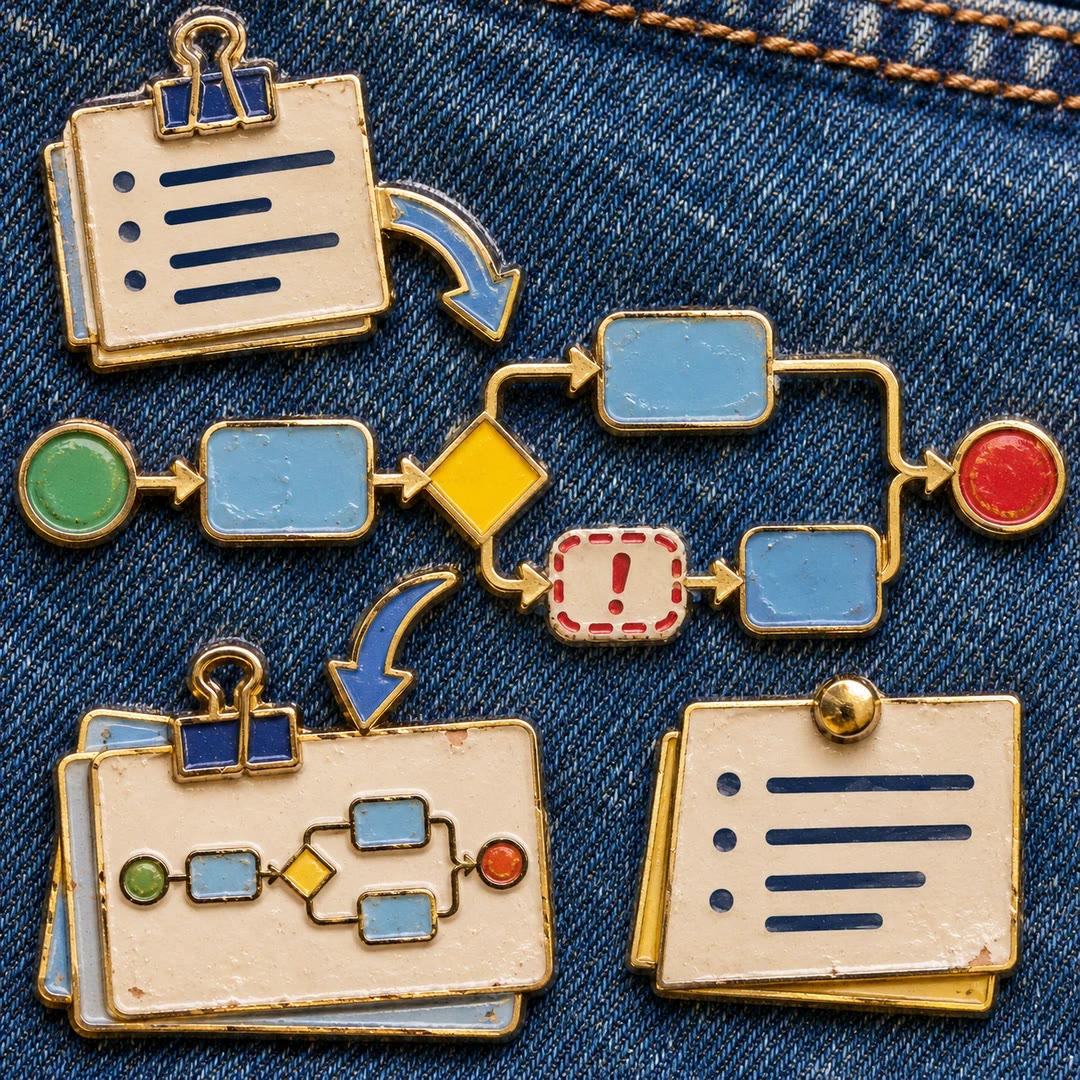
Create interactive flowcharts with AI from a process you can describe and verify. The workflow-visualizer skill extracts steps, roles, timings, dependencies and decision branches, then uses its local renderer to build a diagram. Clicking a node reveals its details, and search helps locate relevant parts.
The main output is a standalone HTML file backed by editable process specifications. It offers portrait and landscape layouts and image exports for documents. This is a snapshot of the supplied process, not a live workflow engine. Passing structural checks does not establish that the real process is correct or that every label is readable.
What it does
- Map a process from written steps
- Build clickable HTML diagrams
- Show dependencies and decision branches
- Export SVG for a document
- Distinguish waiting and review points
- Find steps by searching their text
Install and use
- Provide the complete folder to a file/command-capable agent. Use Node.js 18+ and a browser; the core renderer needs no extra npm package. Choose a dedicated output directory.
- For example: “Draw request intake, document review and approval or return for correction. Show each role and where work waits.” Supply the actual order and conditions.
- Review the extracted specification before rendering. Keep unknown details awaiting confirmation instead of allowing the agent to fill them in.
- Open the HTML and inspect labels, branches and interactions at relevant sizes. Optional local-network viewing should expose only the output folder; stop the server afterwards.
FAQ
Source
Made by jimku233. Original skill: workflow-visualizer, published on GitHub under the MIT licence.
View on GitHubRelated products
- SkillNew
Plan everyday meals with AI
Use confirmed information to choose portions and alternatives, keep planned meals separate from actual intake and optionally retain records in a local folder.
Free - SkillNew
Design BPMN processes with AI
Build an editable BPMN model from a structured process description, inspect flow problems and keep assumptions visible alongside the file.
Free - SkillNew
Document business processes with AI
Interview a process owner and preserve the actual workflow in matching Markdown and JSON files for review and a later builder handover.
Free